Drowning
This section presents information on deaths that occurred as a result Unintentional drowning. NMD records that included the following ICD-10 codes were included in this section:
- the UCoD was Accidental drowning and submersion (W65–W74); or
- the MCoDs included codes for Accidental drowning and submersion (W65–W74) and for Injury (S00–T75 or T79); or
- the MCoDs included codes for Drowning and non-fatal submersion (T75.1) and for an Unintentional external cause of injury (V01–X59).
Suicide and Homicide deaths (UCoD X60–Y09) were excluded.
SES by sex and age
There was only a mild association between SES and the rate of Unintentional drowning deaths overall and for males (Table 2.3). Rates were highest in the 2 most disadvantaged socioeconomic groups and lowest in the second least disadvantaged socioeconomic group. Relatively low case numbers meant that associations between SES and mortality rates should be treated with caution. For females, low case numbers meant that an association between SES and rates of Unintentional drowning deaths could not be meaningfully interpreted.
|
|
Socioeconomic status of area of usual residence | |||||
|---|---|---|---|---|---|---|
|
1—lowest |
2 | 3 | 4 | 5-highest | Total(a) | |
| Males | ||||||
| Deaths |
48 |
50 |
40 |
23 |
31 |
212 |
| Deaths per 100,000(b) | 2.0 | 2.0 | 1.6 | 1.0 | 1.3 | 1.7 |
| Rate ratio (c) | 1.2 | 1.2 | 0.9 | 0.6 | 0.8 | |
| Females | ||||||
| Deaths |
11 |
8 |
11 | 9 | 8 | 52 |
| Deaths per 100,000(b) | 0.4 | 0.3 | 0.5 | 0.4 | 0.3 | 0.4 |
| Rate ratio(c) | 1.0 | 0.8 | 1.3 | 1.0 | 0.8 | |
| Persons | ||||||
| Deaths |
59 |
58 |
51 | 32 | 39 | 264 |
| Deaths per 100,000(b) | 1.2 | 1.2 | 1.0 | 0.7 | 0.8 | 1.1 |
| Rate ratio(c) | 1.1 | 1.1 | 0.9 | 0.6 | 0.7 | |
Notes:
- ‘Total’ includes cases for which the socioeconomic group was not able to be determined.
- Rates are directly age-standardised using populations by socioeconomic status groups, which do not include persons in areas for which the socioeconomic status could not be determined. Therefore, the total standardised rates for analyses by socioeconomic status group differ from rates calculated by state or territory.
- Rate ratio = rate for each individual socioeconomic group/total rate.
Figure 2.7 shows the proportion Unintentional drowning deaths in each socioeconomic group for males and for females. Among males, the largest proportions of deaths were among those in the 2 most disadvantaged socioeconomic groups, while the smallest proportion of deaths were among those in the second least disadvantaged socioeconomic group. Among females, there was less variation than among males in the proportion of deaths across socioeconomic groups – with the largest proportion of deaths occurring in the lowest (most disadvantaged) group and in the middle socioeconomic groups. (Results should be interpreted with caution, due to relatively low case numbers, particularly for females.)
Figure 2.7: Proportion of Unintentional drowning deaths, by socioeconomic group, by sex, Australia, 2015–16
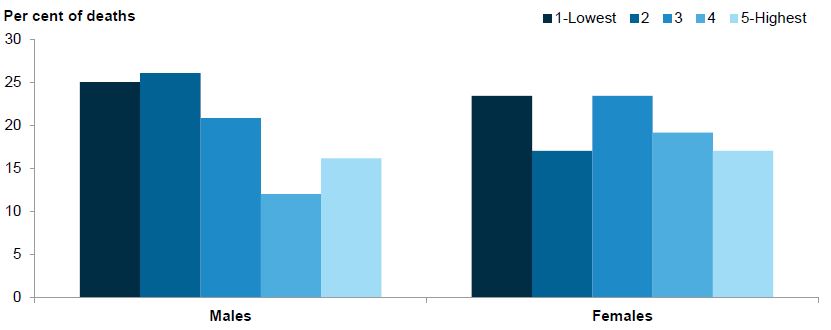
Note: Data underpinning this figure can be found in Table S7 in the supplementary tables spreadsheet.
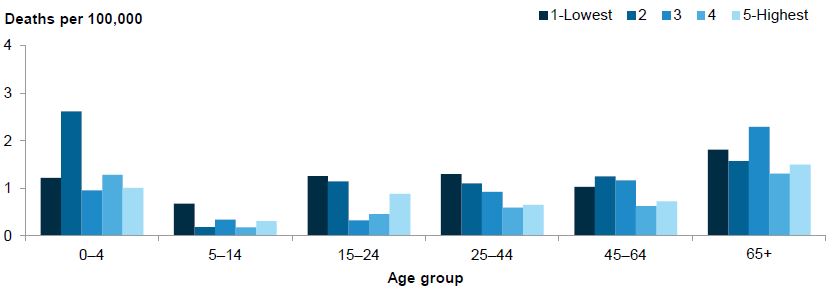
Figure 2.8 shows the age-specific rates of Unintentional drowning deaths, by socioeconomic group. Low case numbers made interpretation of the results in all age groups problematic. (For example, there were fewer than 20 deaths in each socioeconomic group in all age groups.) Rates tended to be higher in the more disadvantaged socioeconomic groups, with the strongest association between rates and socioeconomic disadvantage occurring in the 25–44 age group.
Figure 2.8: Age-specific rates of Unintentional drowning deaths, by age group, by socioeconomic group, Australia, 2015–16
Notes:
- Rates are directly age-standardised using populations by socioeconomic status groups, which do not include persons in areas for which the socioeconomic status could not be determined. Therefore, the total standardised rates for analyses by socioeconomic status group differ from rates calculated by state or territory.
- Data underpinning this figure can be found in Table S8 in the supplementary tables spreadsheet.
Figure 2.9 shows the proportion of Unintentional drowning deaths in each socioeconomic group, by age group. As described above, low case numbers made interpretation of the results in all age groups problematic. There was a tendency for the highest proportion of deaths to occur in the more disadvantaged socioeconomic groups, although patterns varied between age groups. Similar to Figure 2.8, the association between decreasing proportions and increasing socioeconomic advantage was most evident in those aged 25–44.
Figure 2.9: Proportion of Unintentional drowning deaths, by socioeconomic group, by age group, Australia, 2015–16
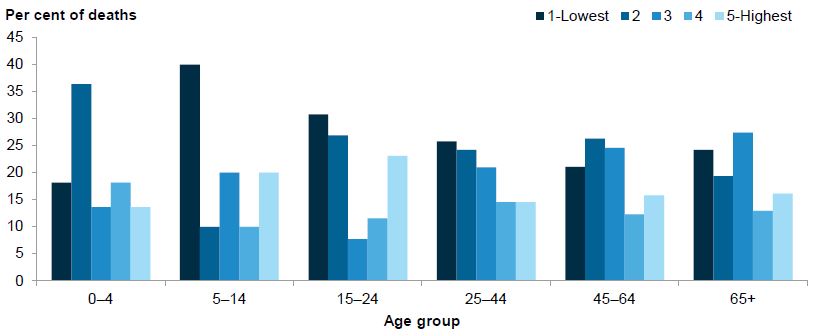
Note: Data underpinning this figure can be found in Table S9 in the supplementary tables spreadsheet.