Homicide
This section presents information on deaths that occurred as a result of Assault. NMD records that included the following ICD-10 codes were included in this section:
- the UCoD was Assault (X85–Y09) or Legal intervention and operations of war (Y35–Y36); or
- the MCoD was Assault (X85–Y09) or Legal intervention and operations of war (Y35–Y36) and Injury (S00–T75 or T79).
Few deaths were included by the second criterion: very few deaths were attributed to operations of war, reflecting the practice that deaths overseas of members of Australian armed forces are not normally registered in Australia (AIHW: Harrison & Henley 2015).
SES by sex and age
In 2015–16, the rate of Homicide deaths declined with increasing socioeconomic advantage. The rate (2.0 deaths per 100,000 population) for those from the lowest (most disadvantaged) socioeconomic group was 4 times as high as the rate for the highest (least disadvantaged) socioeconomic group. Rates for males tended to decline with increasing socioeconomic advantage (Table 2.8). The rate for those from the lowest (most disadvantaged) socioeconomic group was more than double the rate for any of the 4 other socioeconomic groups and 6 times the rate for the highest (least disadvantaged) socioeconomic group. For females, rates were highest in the 2 most disadvantaged socioeconomic groups, with rates in these groups more than 3 times the rates in the 3 least disadvantaged socioeconomic groups (which had identical rates).
|
|
Socioeconomic status of area of usual residence | |||||
|---|---|---|---|---|---|---|
| 1 – lowest | 2 | 3 | 4 | 5-highest | Total(a) | |
| Males | ||||||
| Deaths |
68 |
31 |
33 |
25 |
13 |
171 |
| Deaths per 100,000(b) | 3.0 | 1.3 | 1.4 | 1.0 | 0.5 | 1.4 |
| Rate ratio | 2.1 | 0.9 | 1.0 | 0.7 | 0.4 | |
| Females | ||||||
| Deaths |
19 |
22 |
10 | 10 | 10 | 72 |
| Deaths per 100,000(b) | 0.9 | 1 | 0.4 | 0.4 | 0.4 | 0.6 |
| Rate ratio | 1.5 | 1.7 | 0.7 | 0.7 | 0.7 | |
| Persons | ||||||
| Deaths |
87 |
53 |
43 | 35 | 23 | 243 |
| Deaths per 100,000(b) | 2.0 | 1.1 | 0.9 | 0.7 | 0.5 | 1.0 |
| Rate ratio | 2.0 | 1.1 | 0.9 | 0.7 | 0.5 | |
Notes
- ‘Total’ includes cases for which the socioeconomic group was not able to be determined.
- Rates are directly age-standardised using populations by socioeconomic status groups, which do not include persons in areas for which the socioeconomic status could not be determined. Therefore, the total standardised rates for analyses by socioeconomic status group differ from rates calculated by state or territory.
Figure 2.22 shows the proportion of Homicide deaths in each socioeconomic group for males and for females. Among males, the largest proportion of deaths (40%) occurred in the lowest (most disadvantaged) socioeconomic group, while for females, the 2 most disadvantaged socioeconomic groups accounted for 58% of deaths.
Figure 2.22: Proportion of Homicide deaths, by socioeconomic group, by sex, Australia, 2015–16
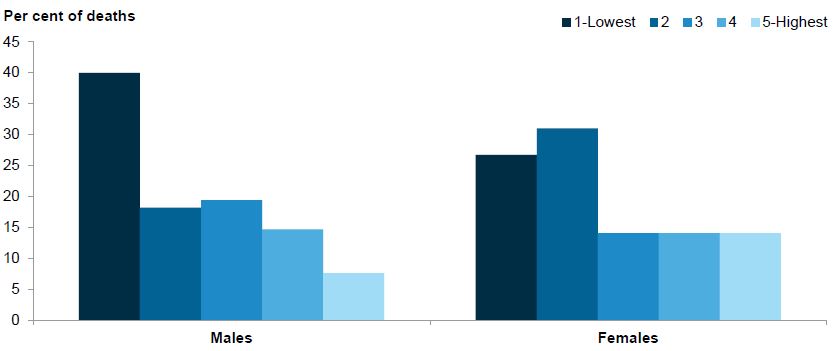
Note: Data underpinning this figure can be found in Table S22 in the supplementary tables spreadsheet.
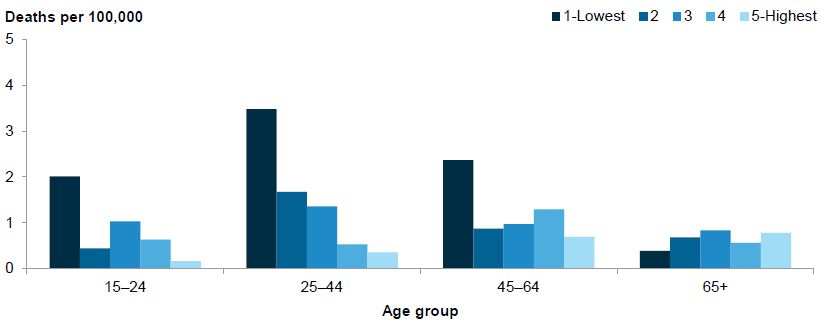
Figure 2.23 shows the age-specific rates of Homicide deaths by socioeconomic group. For those aged 25–44, rates declined markedly with increasing socioeconomic advantage. The rate in this age group for those from the most disadvantaged socioeconomic group (3.5 deaths per 100,000 population) was almost 10 times the rate for those from the least disadvantaged socioeconomic group (0.4 deaths per 100,000 population). For those aged 15–24 and 45–64, rates were much higher in the lowest (most disadvantaged) socioeconomic group when compared with the other socioeconomic groups, while for those aged 65 and over, there was no discernible association between rates and SES. Results were not shown for children aged 0–14, due to low case counts.
Figure 2.23: Age-specific rates of Homicide deaths, by age group, by socioeconomic group, Australia, 2015–16
Notes
- Rates are directly age-standardised using populations by socioeconomic status groups, which do not include persons in areas for which the socioeconomic status could not be determined. Therefore, the total standardised rates for analyses by socioeconomic status group differ from rates calculated by state or territory.
- Data underpinning this figure can be found in Table S23 in the supplementary tables spreadsheet.
Figure 2.24 shows the proportion of Homicide deaths in each socioeconomic group, by age group. Patterns were similar to those observed for rates in Figure 2.23 above. For those aged 25–44, the proportion of deaths declined markedly with increasing socioeconomic advantage, while for those aged 15–24 and 45–64, the proportions of deaths were much higher in the lowest (most disadvantaged) socioeconomic group, when compared with the other socioeconomic groups. For those aged 65 and over, there was no discernible association between the proportions of deaths and SES. Results were not shown for children aged 0–14, due to low case counts.
Figure 2.24: Proportion of Homicide deaths, by socioeconomic group, by age group, Australia, 2015–16
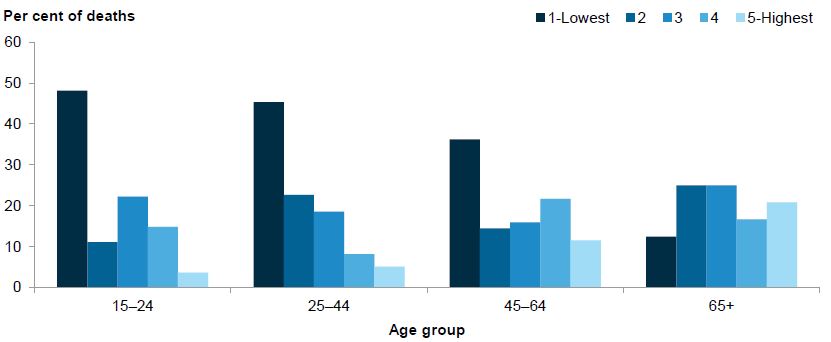
Note: Data underpinning this figure can be found in Table S24 in the supplementary tables spreadsheet.