Unintentional poisoning
This section presents information on deaths that occurred as a result Unintentional poisoning. NMD records that included the following ICD-10 codes were included in this section:
- the UCoD was Accidental poisoning by and exposure to noxious substances (X40–X49); or
- the MCoDs include codes for Accidental poisoning by and exposure to noxious substances (X40–X49) and for Injury (S00–T75 or T79); or
- the MCoDs include codes for Poisoning by drugs, medicaments and biological substances (T36–T50) or Toxic effects of substances chiefly nonmedicinal as to source (T51–T65) and for Unintended external cause of injury (V01–X59).
Suicide and Homicide deaths (UCoD X60–Y09) were excluded.
SES by sex and age
In 2015–16, rates for Unintentional poisoning deaths overall, and for males and females separately, declined steadily with increasing socioeconomic advantage (Table 2.4). For both males and females, the highest rates were for those in the lowest (most disadvantaged) socioeconomic group (12.0 and 5.5 deaths per 100,000 population, respectively). These rates were at least 2 times the corresponding rates for those in the highest (least disadvantaged) socioeconomic group.
|
|
Socioeconomic status of area of usual residence | |||||
|---|---|---|---|---|---|---|
| 1 – lowest | 2 | 3 | 4 | 5 – highest | Total(a) | |
| Males | ||||||
| Deaths |
268 |
237 |
202 |
165 |
140 |
1,022 |
| Deaths per 100,000(b) | 12.0 | 10.3 | 8.7 | 6.8 | 6.0 | 8.8 |
| Rate ratio (c) | 1.4 | 1.2 | 1.0 | 0.8 | 0.7 | |
| Females | ||||||
| Deaths |
132 |
128 |
104 | 78 | 60 | 503 |
| Deaths per 100,000(b) | 5.5 | 5.3 | 4.2 | 3.2 | 2.3 | 4.1 |
| Rate ratio(c) | 1.3 | 1.3 | 1.0 | 0.8 | 0.6 | |
| Persons | ||||||
| Deaths |
400 |
365 |
306 | 243 | 200 | 1,525 |
| Deaths per 100,000(b) | 8.7 | 7.8 | 6.4 | 5 | 4.1 | 6.4 |
| Rate ratio(c) | 1.4 | 1.2 | 1.0 | 0.8 | 0.6 | |
Notes
- ‘Total’ includes cases for which the socioeconomic group was not able to be determined.
- Rates are directly age-standardised using populations by socioeconomic status groups, which do not include persons in areas for which the socioeconomic status could not be determined. Therefore, the total standardised rates for analyses by socioeconomic status group differ from rates calculated by state or territory.
- Rate ratio = rate for each individual socioeconomic group/total rate.
As for rates (see Table 2.4), the proportion of Unintentional poisoning deaths for both males and females declined steadily with increasing socioeconomic advantage (Figure 2.10). For both sexes, the proportion of deaths within the lowest (most disadvantaged) socioeconomic groups was close to 2 times as high as the proportion of deaths within the highest (least disadvantaged) socioeconomic groups.
Figure 2.10: Proportion of Unintentional poisoning deaths, by socioeconomic group, by sex, Australia, 2015–16
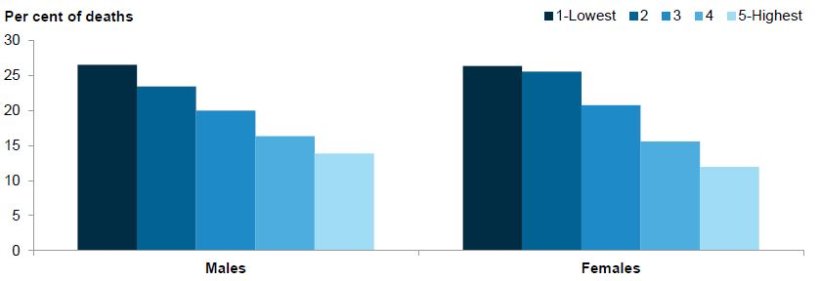
Note: Data underpinning this figure can be found in Table S10 in the supplementary tables spreadsheet.
Figure 2.11 shows the age-specific rates of Unintentional poisoning deaths by socioeconomic group. Rates of Unintentional poisoning deaths declined markedly with increasing socioeconomic advantage for those aged 25–44 and 45–64. For those aged 25–44, the rate in the lowest (most disadvantaged) socioeconomic group was 1.8 times as high as the rate for those in the highest (least disadvantaged) group, while the equivalent figure for those aged 45–64 was 2.8 times as high. Rates for those aged 15–24 and 65 and over tended to be higher in the most disadvantaged socioeconomic groups, but the association between changes in rates and SES was not as strong as for those aged 25–44 and 45–64. Rates for children aged 0–4 and 5–14 are not shown, due to low case counts.
Figure 2.11: Age-specific rates of Unintentional poisoning deaths, by age group, by socioeconomic group, Australia, 2015–16
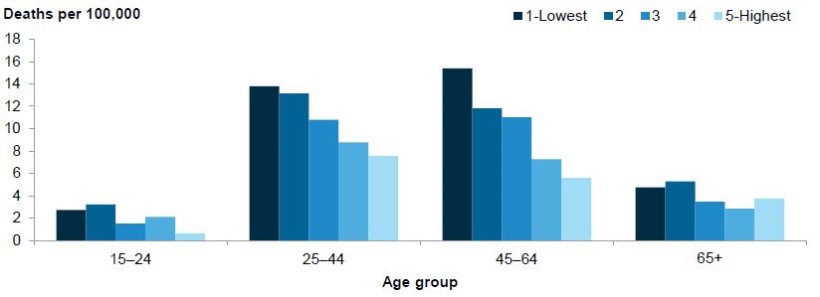
Notes
- Rates are directly age-standardised using populations by socioeconomic status groups, which do not include persons in areas for which the socioeconomic status could not be determined. Therefore, the total standardised rates for analyses by socioeconomic status group differ from rates calculated by state or territory.
- Data underpinning this figure can be found in Table S11 in the supplementary tables spreadsheet.
Figure 2.12 shows the proportion of Unintentional poisoning deaths in each socioeconomic group, by age group. The proportion of Unintentional poisoning deaths declined steadily with increasing socioeconomic advantage for those aged 25–44 and 45–64, with the strongest association between the proportion of deaths and SES observed in the older of these 2 age groups. Proportions of deaths for those aged 15–24 and 65 and over tended to be higher in the most disadvantaged socioeconomic groups, although the association between the proportion of deaths and SES was not as steady as for those aged 25–44 and 45–64. Proportions of deaths for children aged 0–4 and 5–14 by socioeconomic group are not shown, due to low case counts.
Figure 2.12: Proportion of Unintentional poisoning deaths, by socioeconomic group, by age group, Australia, 2015–16
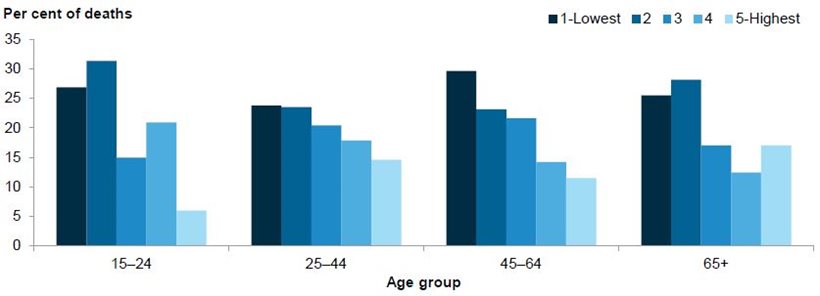
Note: Data underpinning this figure can be found in Table S12 in the supplementary tables spreadsheet.