Homicide deaths
An analysis of changes over time for the lowest (most disadvantaged) and highest (least disadvantaged) socioeconomic groups for Homicide deaths is shown in Figure 3.14. Over the period from 2009–10 to 2015–16, rates of Homicide deaths in the lowest (most disadvantaged) group ranged from 1.7 to 5.3 times as high annually as rates in the highest (least disadvantaged) group.
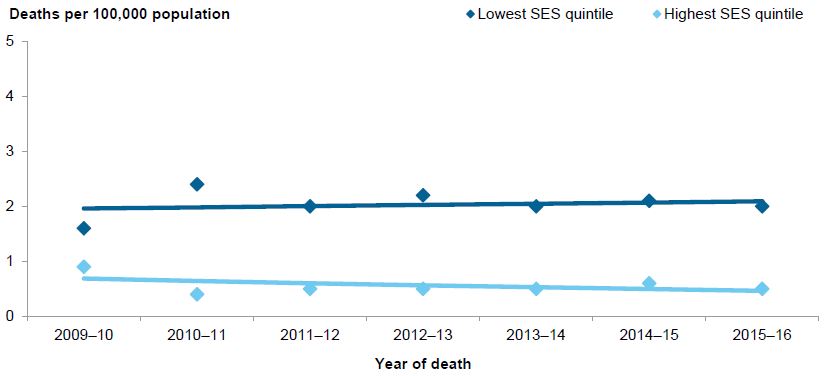
Rates of Homicide deaths increased over time for the lowest (most disadvantaged) socioeconomic group. In contrast, rates decreased over time for the highest (least disadvantaged) socioeconomic group. For the lowest (most disadvantaged) group, rates increased from 1.6 to 2.0 deaths per 100,000 between 2009–10 and 2015–16. The rise in the modelled rate averaged 1.1% per year but was not statistically significant. For the highest (least disadvantaged) group, rates decreased from 0.9 to 0.5 deaths per 100,000 between 2009–10 and 2015–16. The drop in the modelled rate averaged 6.4% per year but was not statistically significant.
Average annual changes in rates, by age group, are not reported on here due to low case counts in most age groups, particularly in the least disadvantaged group. The average annual changes in rates were not statistically significant for any of the age groups for either the lowest (most disadvantaged) or highest (least disadvantaged) socioeconomic groups.
Figure 3.14: Modelled age-standardised rates of homicide deaths, by lowest and highest socioeconomic groups, Australia, 2009–10 to 2015–16
Notes
- The solid lines represent the modelled rates from 2009–10 to 2015–16. The filled symbols represent the observed age-standardised rate value for each year.
- Data underpinning this figure can be found in Table S38 in the supplementary tables spreadsheet.