This content contains information some readers may find distressing.

If you, or someone you know needs help, contact Lifeline on 13 11 14. Go to the crisis and support services page for a list of support services.

Injuries from overexertion are typically the result of physical stress or overuse of the body. This can include from lifting heavy objects, repetitive movements, motion sickness, or lack of food or water.

Overexertion and related injuries caused:

13,300 hospitalisations in 2021–22

52 per 100,000 population

 13 deaths in 2020–21

0.1 per 100,000 population

This represents around 2% of injury hospitalisations.

In males, the 25-44 age group had the highest risk, while in females, the 65 and over group had the highest risk.

Injuries from overexertion are represented by the ICD external cause codes X50–57. Overexertion and strenuous or repetitive movements account for almost all hospitalisations in this group.

This chapter summarises data on unintentional injuries only. Intentional injuries and deaths are included under Self-harm injuries and suicide or Assault and homicide.

Deaths from overexertion injuries are rare, and are not discussed in detail below.

Causes of hospitalisation

In 2021–22, almost all hospitalisations in this group were caused by overexertion and strenuous or repetitive movements (Table 1).

Table 1: Causes of injury in overexertion hospitalisations, 2021–22

Location

Hospitalisations

%

Rate (per 100,000)

Overexertion and strenuous or repetitive movements (X50)

13,299

99.7

51.8

Travel and motion (X51)

19

0.1

0.1

Lack of food or water, or other privation (X52–57)

26

0.2

0.1

Total

13,344

100

51.9

Notes

  1. Rates are crude per 100,000 population.
  2. Percentages may not total 100 due to rounding.
  3. Codes in brackets refer to the ICD-10-AM (11th edition) external cause codes (ACCD 2019).

Source: AIHW National Hospital Morbidity Database.

For more detail, see Data tables B23–24.

Trends over time

Over the period from 2017–18 to 2021–22, the age-standardised rate of injury hospitalisations due to overexertion decreased by an annual average of 4.2%. From 2012–13 to 2016–17 there was an average annual increase of 4.3% (Figure 1).

There is a break in the time series for hospitalisations between 2016–17 and 2017–18, due to a change in data collection methods (see the Technical notes for details).

Figure 1: Overexertion injury hospitalisations, by sex and year

Line graphs for hospitalisations over 10 years. The 3 lines represent the trend for males, persons, and females. The reader can choose to display rate per 100,000 population or number.

Visualisation not available for printing

For more detail, see Data tables C1–3 and F1–4.

Seasonal differences

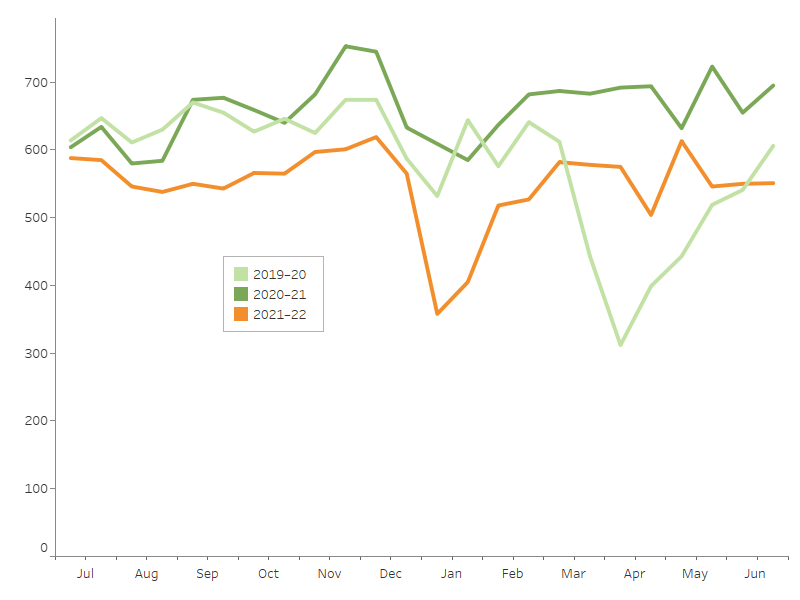
Hospitalisations for overexertion injuries remain relatively steady over the year, with a dip over December and January.

There were large dips in March 2020 and December to January 2021–22, which could both be related to the challenges to the hospital system created by COVID-19 (Figure 2).

The interactive display illustrates other seasonal differences in injury hospitalisations.

Figure 2: Seasonal differences in overexertion injury hospitalisations, 2019–20 to 2021–22

3 line graph representing the trends for 2019-20, 2020-21 and 2021-22

Notes
1. Admission counts have been standardised into two 15-day periods per month.
2. A scale up factor has been applied to June admissions to account for cases not yet separated.

Source: AIHW National Hospital Morbidity Database.

Age and sex differences

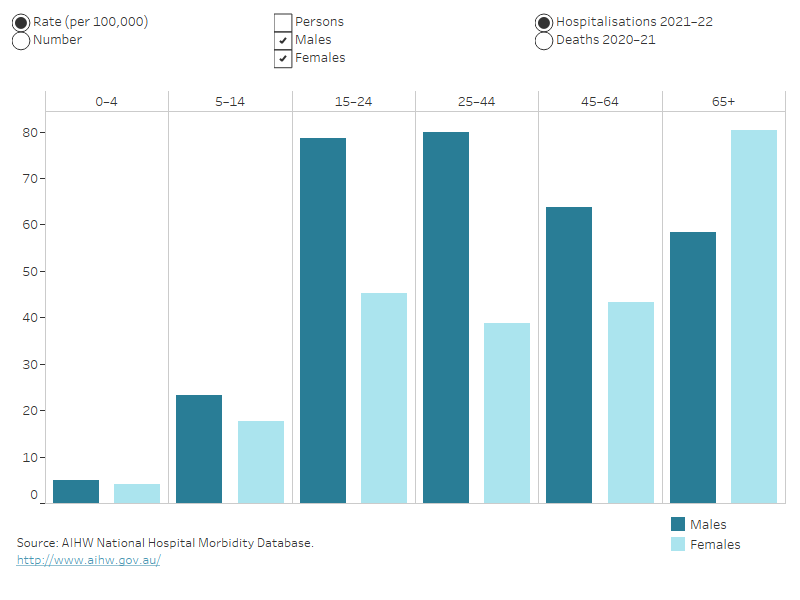
Rates of hospitalisation from overexertion injuries differ between males and females over the life-stages (Figure 3). In 2021–22:

  • 58% of hospitalisations were for males
  • for males, the highest rate was in the 25–44 age group
  • for females, the highest rate was for those aged 65 and over. This is the only age group where females had higher rates of overexertion injuries than males.
  • the age-standardised rates of overexertion hospitalisations were 61 cases per 100,000 males, and 41 per 100,000 females.

Figure 3: Overexertion injury hospitalisations, by age group and sex, 2021–22

Column graph representing sex within 6 life-stage age groups. The reader can choose to display for each age group either rate per 100,000 population or number. The default displays rate of hospitalisations for males and females and the reader can also choose to display persons, and display deaths.

For more detail, see Data tables A1–3 and D1–3.

Severity

There are many ways that the severity, or seriousness, of an injury can be assessed. Some of the ways to measure the severity of hospitalised injuries are:

  • number of days in hospital
  • time in an intensive care unit (ICU)
  • time on a ventilator
  • in-hospital deaths.

Overexertion injuries appear to be less severe than the average for all hospitalised injuries in 2021–22 (Table 2).

Table 2: Severity of overexertion injury hospitalisations, 2021–22
 

Overexertion

All injuries

Average number of days in hospital

2.5

4.7

% of cases with time in an ICU

0.2

2.0

% of cases involving continuous ventilatory support

0.1

1.1

In-hospital deaths (per 1,000 cases)

0.0

5.9

Note: Average number of days in hospital (length of stay) includes admissions that are transfers from one hospital to another or transfers from one admitted care type to another within the same hospital, except where care involves rehabilitation procedures.

Source: AIHW National Hospital Morbidity Database.

For more detail, see Data tables A13–15.

Nature of injuries sustained

In 2021–22, the hip and lower limb was the body area most often identified as the main site of injury in overexertion hospitalisations (Figure 4).

Figure 4: Overexertion hospitalisations, by main body part injured, 2021–22

Outline of a person with labels for body parts accounting for hospitalisations due to overexertion. Injuries to the hip and leg accounted for the most hospitalisations, while the head and neck accounted for the fewest.

Visualisation not available for printing

Notes

  1. Main body part refers to the principal reason for hospitalisation.
  2. ‘Trunk’ includes thorax, abdomen, lower back, lumbar spine & pelvis.
  3. Number and percentage of injuries classified as Other, multiple, and incompletely specified body regions and Injuries not described in terms of body region not shownsee Data table A11.

Source: AIHW National Hospital Morbidity Database.

For more detail, see Data table A11.

Soft-tissue injury was the most common type of injury for people who were hospitalised due to overexertion. This type of injury can include repetitive strain injury. The rate of hospitalisations for soft-tissue injuries in males was about twice the rate for females (Figure 5).

Figure 5: Overexertion hospitalisations, by type of injury, 2021–22

Bar graph showing type of injury sustained by category and by sex. Soft tissue injury was the most common for both males and females but 1.7 times as frequent for males as for females. Fracture was the second most common injury for both males and females. The reader can choose to display either the crude rate per 100,000 population or the number of cases. The default display shows data for males and females, and the reader can also choose to display for persons.

Visualisation not available for printing

For more detail, see Data table A10.

Aboriginal and Torres Strait Islander people

In 2021–22, among Aboriginal and Torres Strait Islander people:

  • there were over 610 hospitalisations (Table 3) and fewer than 5 deaths due to overexertion
  • males were 1.4 times as likely as females to be hospitalised
  • hospitalisation rates were highest among people aged 25–44 (Figure 5).
Table 3: Overexertion injury hospitalisations, by sex, Indigenous Australians, 2021–22


Males

Females

Persons

Number

      348

257

605

Rate (per 100,000)

79

59

 69

Note: Rates are crude per 100,000 population.
Source: AIHW National Hospital Morbidity Database.

Indigenous and non-Indigenous Australians

In 2021–22, Indigenous Australians, compared with non-Indigenous Australians, were 1.6 times as likely to be hospitalised due to overexertion (Table 4).

Table 4: Age-standardised rates (per 100,000) of overexertion injury hospitalisations, by Indigenous status and sex, 2021–22


Males

Females

Persons

Indigenous Australians

90

64

 77

Non-Indigenous Australians

59

39

49

Notes

  1. Rates are age-standardised per 100,000 population.
  2. ‘Non-Indigenous Australians’ excludes cases where Indigenous status is missing or not stated.

Source: AIHW National Hospital Morbidity Database.

The age group with the highest rate of overexertion hospitalisations among Indigenous Australians was the 25–44 year-olds (Figure 6).

Figure 6: Overexertion injury hospitalisations, by Indigenous status, by age group and sex, 2021–22

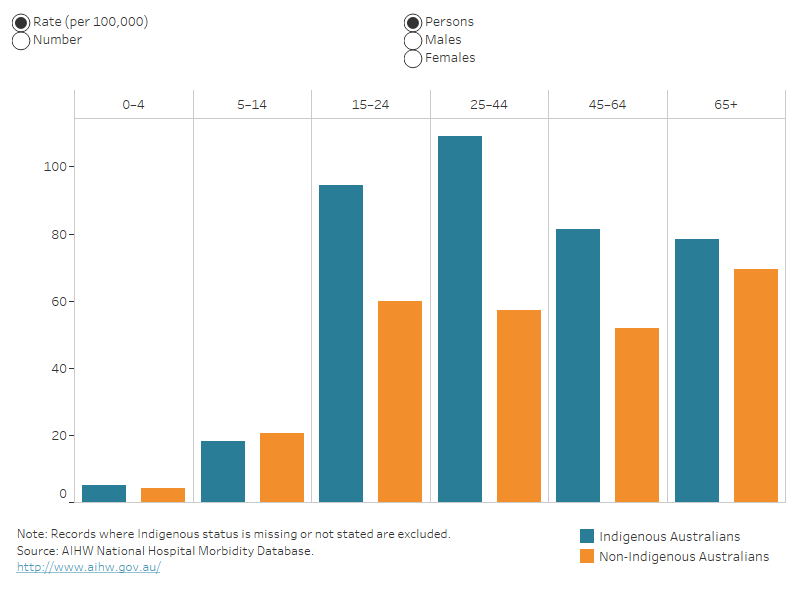
Column graph for hospitalisations. The columns represent data for Indigenous and non-Indigenous Australians by 6 life-stage age groups. For each age group, the reader can choose to display rate per 100,000 population or number. The reader can also choose to display data for persons, males, or females.

For more detail, see Data tables A4–A6 and D4–D8.

Remoteness

In 2021–22 males living in Remote areas had the highest rates of hospitalisation due to overexertion (Table 5).

Table 5: Age-standardised rates (per 100,000) of overexertion injury hospitalisation, by remoteness and sex, 2021–22
 

 Males

 Females

 Persons

Major cities

               57

               37

47

Inner regional

               69

               46

57

Outer regional

               71

               50

61

Remote

               74

               63

68

Very remote

               65

               68

66

Note: Rates are age-standardised per 100,000 population.
Source: AIHW National Hospital Morbidity Database.

The highest age-specific rate of overexertion hospitalisation cases was among the 15–24 age group living in Remote areas of Australia. (Figure 7).

Figure 7: Overexertion injury hospitalisations, by remoteness, by age group and sex, 2021–22

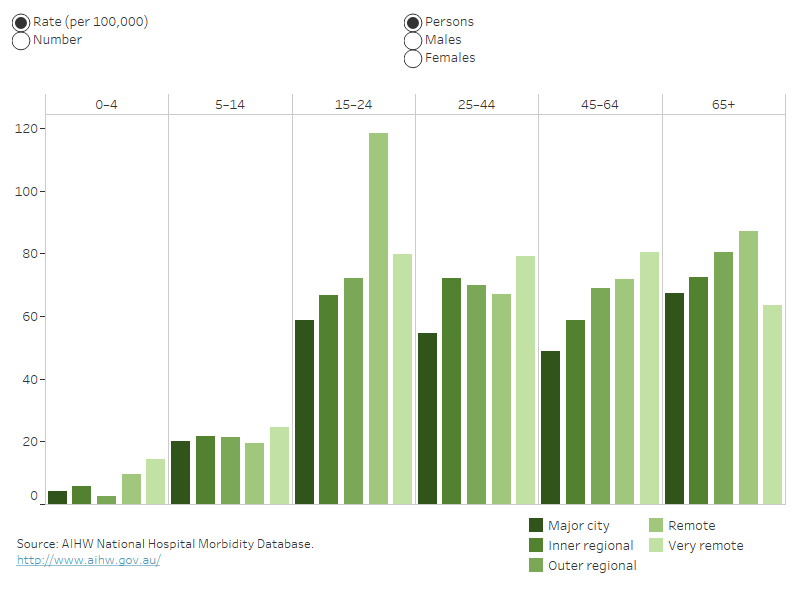
Column graph for hospitalisations. The columns represent data for each of the 5 remoteness categories by 6 life-stage age groups. For each age group, the reader can choose to display rate per 100,000 population or number. The reader can also choose to display data for persons, males, or females.

For more detail, see Data tables A7–A9 and D9–10.

For information on how the statistics were calculated by remoteness, see the technical notes.

Data details

Technical notes: how the data were calculated

Data tables: download the full tables

Glossary