Roller sports

Roller sports include skateboarding, rollerblading, and non-motored scooters.
An estimated 282,000 Australians aged 15 and over participated in roller sports in 2020–21 (ASC, 2021). There were about 5,000 injury hospitalisations attributed to roller sports—3,200 male and 1,800 female. For those aged 15 and over, the rate of hospitalisation was about 1,130 per 100,000 participants.
Between 2018–19 and 2020–21, there was a 50% increase in the age-standardised rate of hospitalisations for males, and a 123% increase for females. (Figure 1).
This increase in injury hospitalisations may be related to an increase in participation overall, the influence of COVID-19 restrictions on recreation choices, a new type of roller sport, or some combination of these. The ‘Seasonal differences’ section and Figure 5 illustrate how these hospitalisations are distributed over the months of the year.
Figure 1: Trend in roller sports injury hospitalisations sports, by sex, 2011–12 to 2020–21
For more detail, see data tables B3–4.
The highest number of hospitalisations was in the 10–14 age group (Figure 2).
Figure 2: Age distribution of injury hospitalisations from roller sports, 2020–21
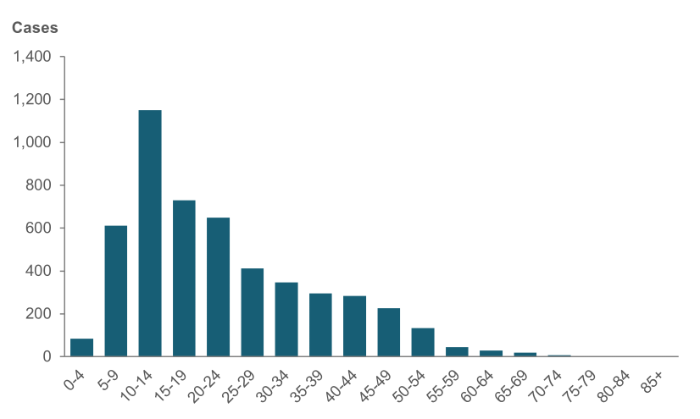
Source: AIHW NHMD.
For more detail, see data table A14.
About 7 in 10 of these hospitalisations (73%) were fractures (Figure 3).
Figure 3: Injury hospitalisations from roller sports, by type of injury as a proportion, 2020–21
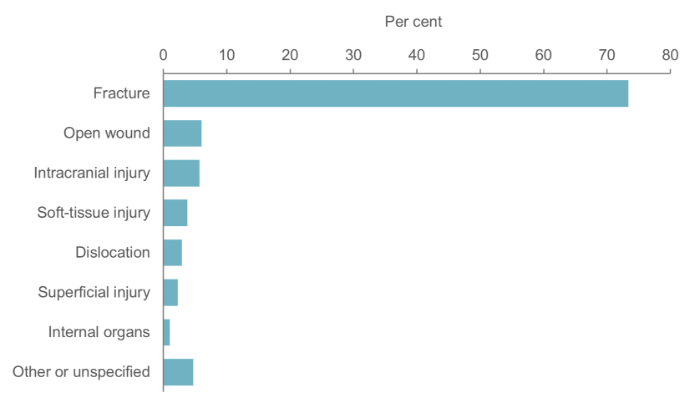
Note: Type of injury is derived from the principal diagnosis.
Source: AIHW NHMD.
For more detail, see data table A25.
There were 205 hospitalisations for concussion—155 male and 50 female.
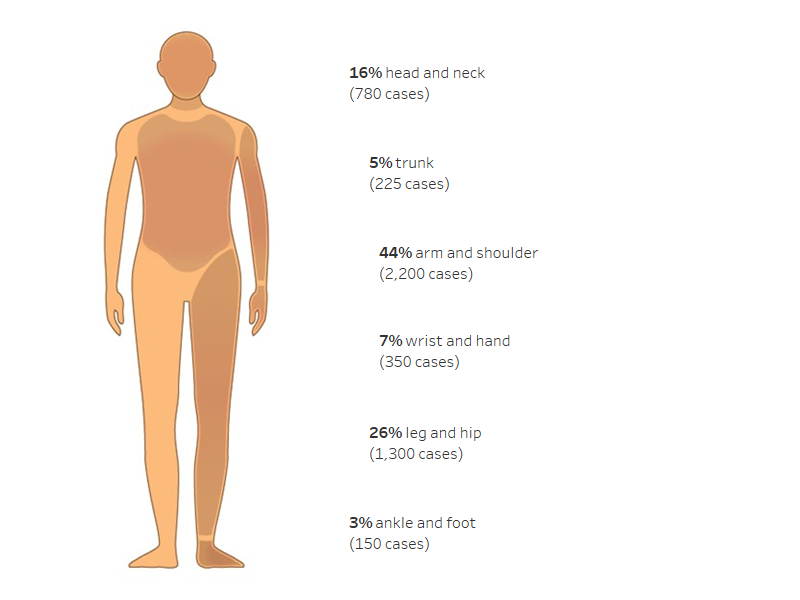
The main site of injury was most often the arm and shoulder region (44%), followed by the leg and hip region (26%) (Figure 4).
Figure 4: Injury hospitalisations from roller sports, by body part injured, as a proportion, 2020–21
Notes
1. Body part injured is derived from the principal diagnosis.
2. ‘Trunk’ includes thorax, abdomen, lower back, lumbar spine & pelvis.
Source: AIHW NHMD.
For more detail, see data table A26.
When specified, the cause of 9 out of 10 of these injuries (92%) was a fall (Figure 5).
Figure 5: Cause of injury as a proportion when specified, injury hospitalisations from roller sports, 2020–21
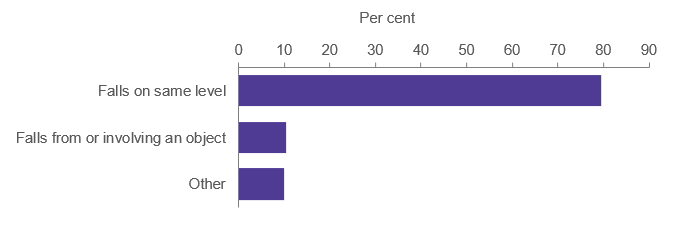
Source: AIHW NHMD.
For more detail, see data table A27.
Seasonal differences
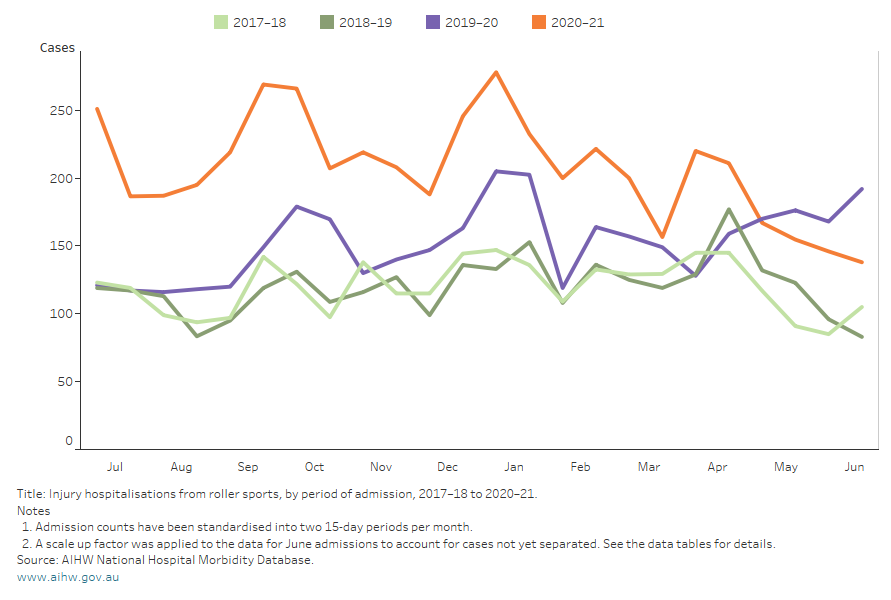
The pattern of injury hospitalisations in 2020–21 and 2019–20 was different to the two previous years. There were larger peaks in September/October and December/January, suggesting additional activity coinciding with school holiday periods. These larger peaks first appeared in late 2019, before the arrival of COVID-19 (Figure 6). They could be caused by increased participation, a new mode of roller sport, or some combination of these.
There was also an increase after March 2020 (and the arrival of COVID-19) compared with the previous years, and hospitalisation numbers remained at a higher level through most of 2020–21.
Figure 6: Injury hospitalisations from roller sports by month of admission, 2017–18 to 2020–21
For more detail, see data table B3.