Soccer

An estimated 1.2 million Australians aged 15 and over played soccer in 2020–21 (ASC, 2021). There were 5,100 injury hospitalisations attributed to soccer—4,200 male and 880 female. For those aged 15 and over, the rate of hospitalisation was about 330 per 100,000 participants.
Following a dip in 2019–20 related to COVID-19 lockdowns, soccer injury hospitalisations in 2020–21 were similar to 2018–19 (Figure 1).
Figure 1: Trend in soccer injury hospitalisations, by sex, 2011–12 to 2020–21
For more detail, see data tables B3–4.
The highest number of hospitalisations in 2020–21 was in the 15–19 age group (Figure 2).
Figure 2: Age distribution of soccer injury hospitalisations, 2020–21
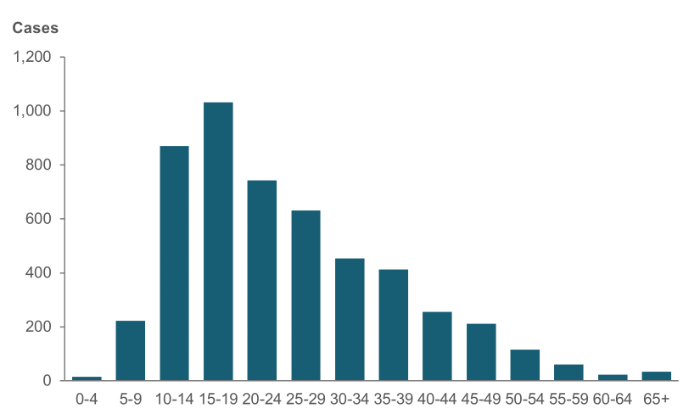
Source: AIHW NHMD.
For more detail, see data table A14.
Over half of hospitalisations were fractures (54%), and over a quarter were soft-tissue injuries (26%) (Figure 3).
Figure 3: Soccer injury hospitalisations, by type of injury as a proportion, 2020–21
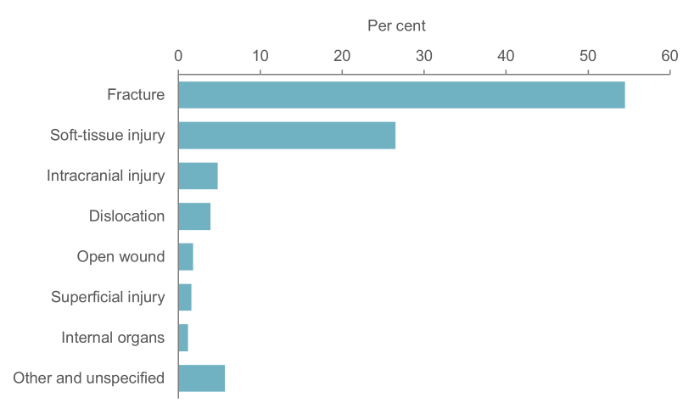
Note: Type of injury is derived from the principal diagnosis.
Source: AIHW NHMD.
For more detail, see data table A25.
There were 225 hospitalisations for concussion (4.5%).
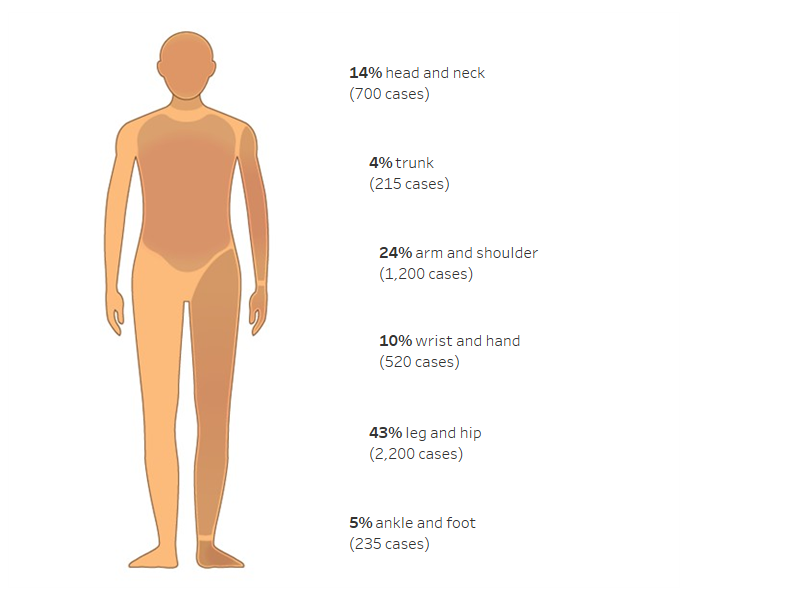
The main injury was most often to the leg or hip (43%), followed by the arm or shoulder (24%) (Figure 4).
Figure 4: Soccer injury hospitalisations, by body part injured, as a proportion, 2020–21
Notes
1. Body part injured is derived from the principal diagnosis.
2. ‘Trunk’ includes thorax, abdomen, lower back, lumbar spine & pelvis.
Source: AIHW NHMD.
For more detail, see data table A26.
Where it was specified, the most common cause of injury was contact with another person, and the next most common was falls involving an object (Figure 5).
Figure 5: Cause of injury as a proportion when specified, soccer injury hospitalisations, 2020–21
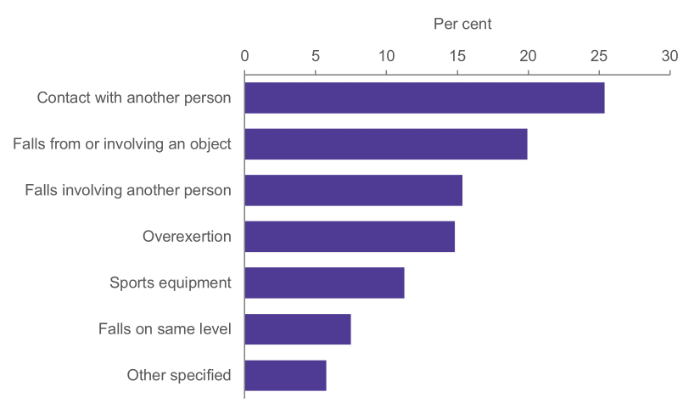
Source: AIHW NHMD.
For more detail, see data table A27.
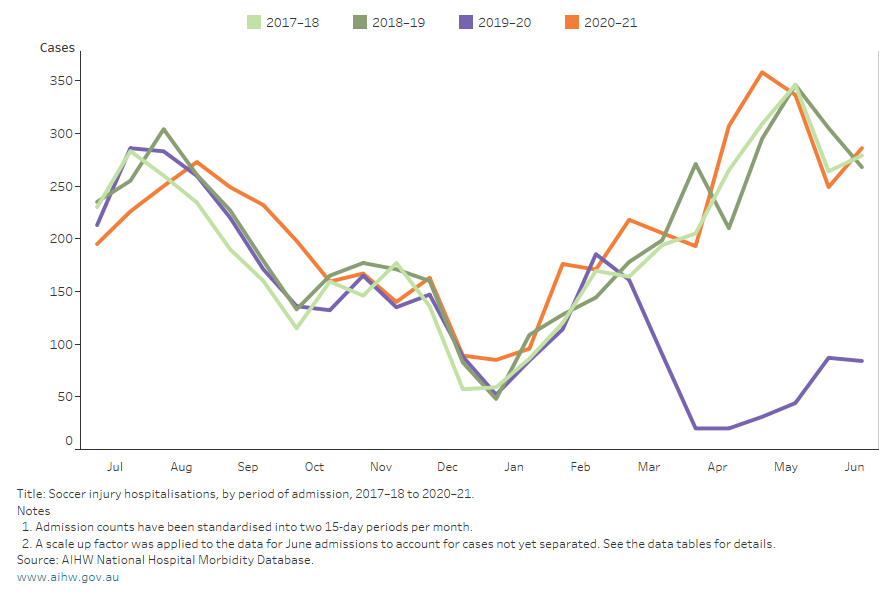
Seasonal differences
Amateur soccer is a winter sport in Australia and injury hospitalisations are usually highest between March and September.
The temporary interruption caused by COVID-19 lockdowns is reflected by a drop in injuries from March 2020 (Figure 6).
Figure 6: Soccer injury hospitalisations by month of admission, 2017–18 to 2020–21
For more detail, see data table B3.