Wheeled motor sports

Wheeled motor sports include motorbike racing and jumping, car racing, all-terrain vehicle riding and go-carting.
An estimated 303,000 Australians aged 15 and over participated in wheeled motor sports in 2020–21 (ASC, 2021). There were 4,500 injury hospitalisations attributed to wheeled motor sports—4,100 male and 425 female. For those aged 15 and over, the rate of hospitalisation was about 1,200 per 100,000 participants.
The age-standardised rate of hospitalisations for injuries from wheeled motor sports increased by 21% between 2019–20 and 2020–21 (Figure 1).
Figure 1: Trend in injury hospitalisations from wheeled motor sports, by sex, 2011–12 to 2020–21
For more detail, see data tables B3–4.
The highest number of hospitalisations was in the 15–19 age group (Figure 2).
Figure 2: Age distribution of injury hospitalisations from wheeled motor sports, 2020–21
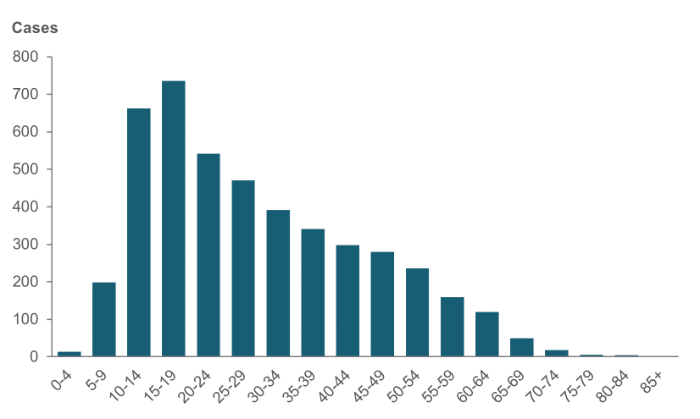
Source: AIHW NHMD.
For more detail, see data table A14.
Almost 6 in 10 of these hospitalisations were fractures (59%) (Figure 3).
Figure 3: Injury hospitalisations from wheeled motor sports, by type of injury as a proportion, 2020–21
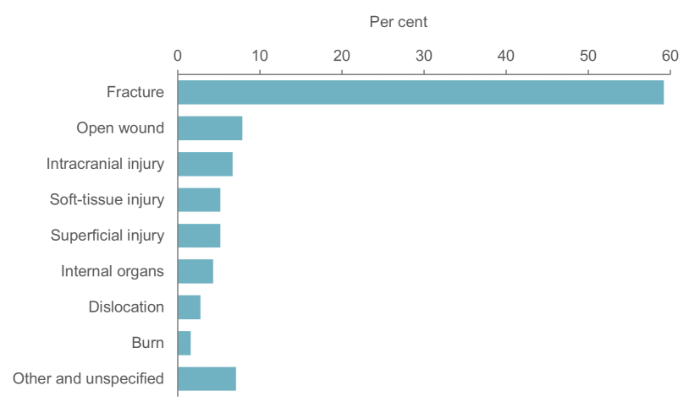
Note: Type of injury is derived from the principal diagnosis.
Source: AIHW NHMD.
For more detail, see data table A25.
There were 230 hospitalisations for concussion—200 male and 30 female.
The main injury was most commonly to the arm or shoulder (28%), followed by the leg or hip (24%) (Figure 4).
Figure 4: Injury hospitalisations from wheeled motor sports, by body part injured, as a proportion, 2020–21
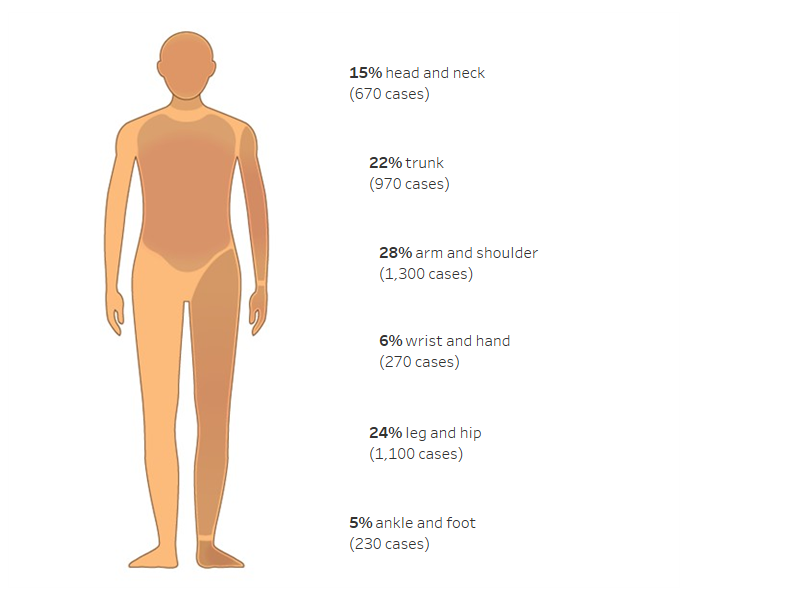
Notes
1. Body part injured is derived from the principal diagnosis.
2. ‘Trunk’ includes thorax, abdomen, lower back, lumbar spine & pelvis.
Source: AIHW NHMD.
For more detail, see data table A26.
Where the cause of injury was specified, it was most often a road transport accident (88%) (Figure 5).
Figure 5: Cause of injury as a proportion when specified, injury hospitalisations from wheeled motor sports, 2020–21
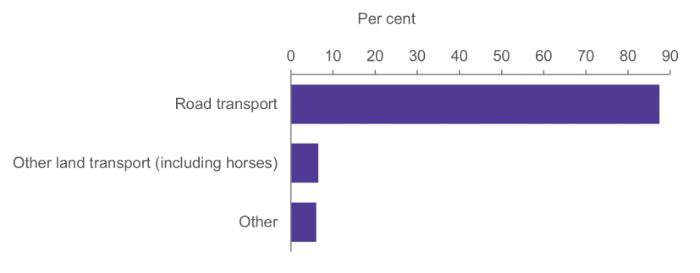
Source: AIHW NHMD.
For more detail, see data table A27.
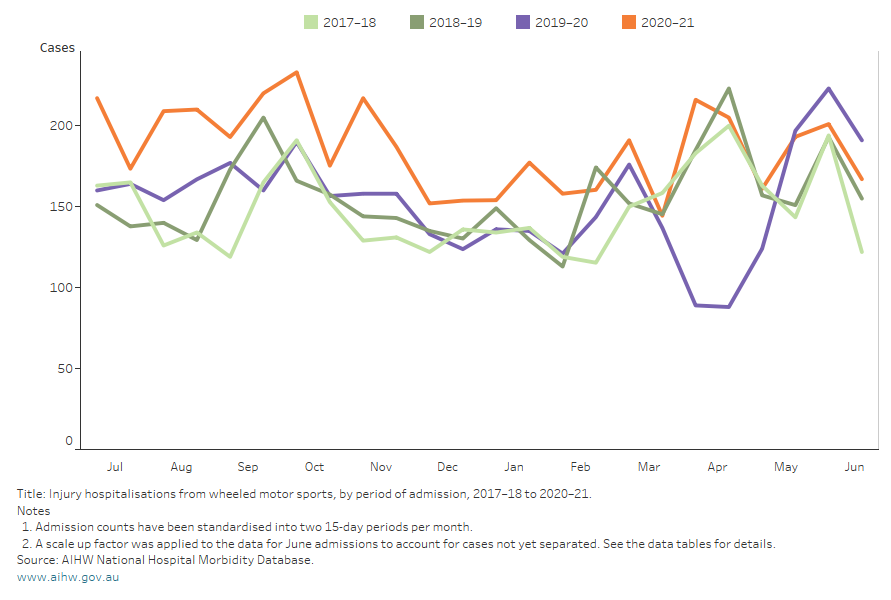
Seasonal differences
Injury hospitalisations from wheeled motor sports have a relatively even distribution over the year compared with other sports. A short dip in hospitalisations after March 2020 may be connected to COVID-19 restrictions (Figure 6).
Figure 6: Injury hospitalisations from wheeled motor sports by month of admission, 2017–18 to 2020–21
For more detail, see data table B3.