Sports participation and rates of injury
Bear in mind when making comparisons between sports that there are limitations in each of the data sets involved. Rates of injury per participant should be treated as estimates and are for those aged 15 and over only.
Nine in 10 adults participate in sport or physical activity
According to the AusPlay survey, about 18.8 million Australians aged 15 and over (89%) played sport or took part in physical activities in 2020–21.
In 2020–21:
- the most popular activity was recreational walking (9.9 million participants), followed by fitness and gym (8.6 million), and running and athletics (4.4 million) (Figure 8)
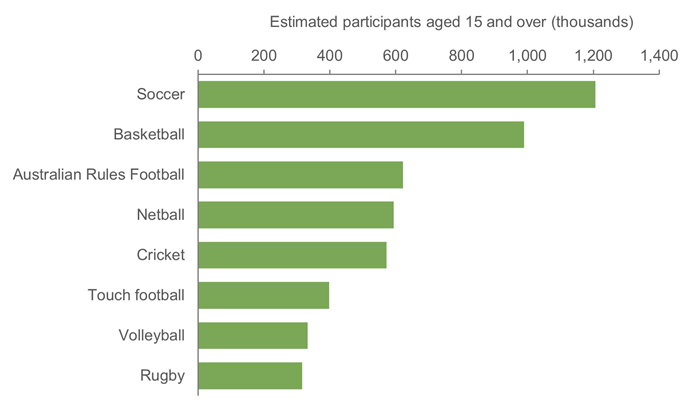
- the most popular team sports were soccer (1.2 million participants), basketball (990,000) and Australian Rules Football (622,000) (Figure 9).
The survey classifies individual physical activity and organised team sport in the same way. A participant is someone who took part at least once in the previous 12 months.
Figure 8: Ten most popular physical activities by estimated number of participants in Australia, 2020–21
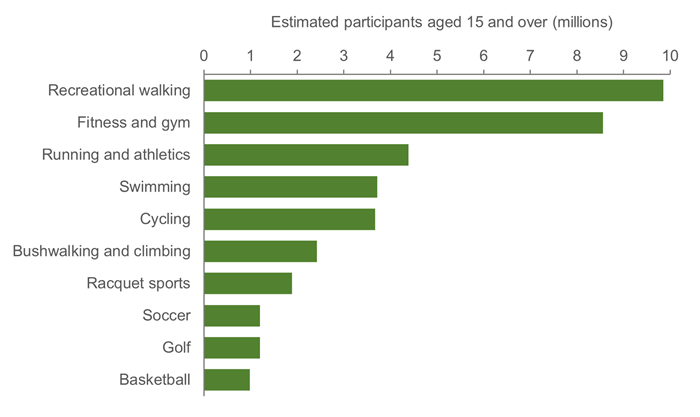
Source: Australian Sports Commission, AusPlay.
Figure 9: Popular team sports by estimated number of participants in Australia, 2020–21
Notes
1. ‘Volleyball’ includes both indoor and outdoor
2. ‘Rugby’ includes both major codes.
Source: Australian Sports Commission, AusPlay.
For more detail, see data table A29 and appendix.
Outdoor team sports had the highest rates of injury in 2022
In 2022, for the first time, the AusPlay survey asked participants in sports and physical activities if they had been injured while participating. While analysis by individual sports is not yet practical, the results give the estimated number of injuries and rate of injury per participant for various categories of sport or activity.
The highest rate of reported injury per participant was for the Outdoor team sports category, with about a quarter of participants (26%) injured in 2022. Combat sports was next with about 16% of participants injured, closely followed by Indoor team sports, motor and horse sports each with about 15% injured (ASC, 2023).
Cycling has the highest number of hospitalisations
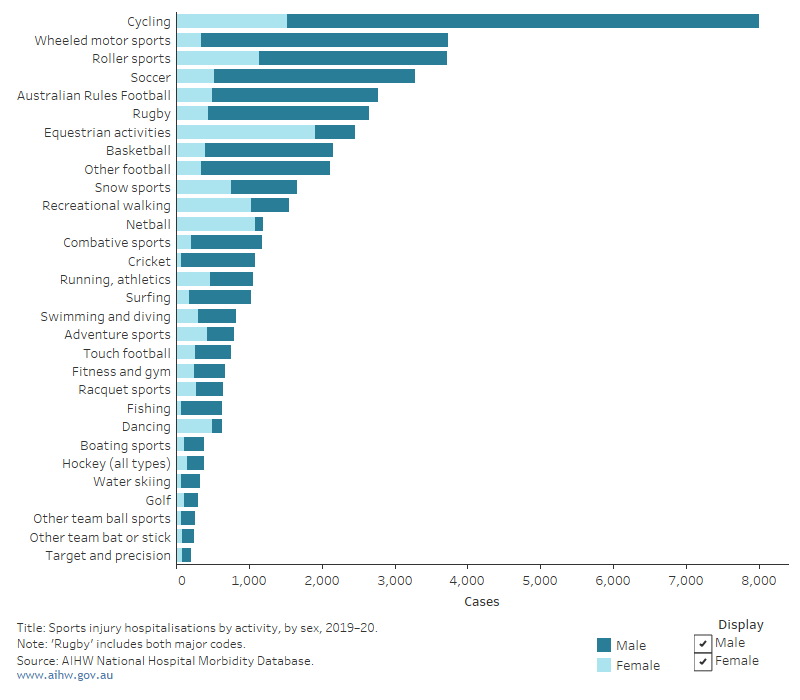
The sports responsible for the most injury hospitalisations in 2020–21 were those that involved wheels, and various types of football. Cycling saw around 9,800 reported injury hospitalisations, followed by soccer (5,100), roller sports (5,000) and rugby (5,000) (Figure 10).
Together, the 3 main specified types of football (Australian rules, rugby, and soccer) were attributed 14,800 hospitalisations. However, because generic terms are often used for any or all of the football codes, a relatively large number of injury hospitalisations are attributed to ‘other and unspecified football’ (3,000 cases in 2020–21).
There are some differences between males and females. For males, the number one cause of hospitalisation was cycling, whereas for females it was equestrian activities. You can view males and females separately in the following graph by using the filter at the bottom right.
Figure 10: Sports injury hospitalisations by activity, by sex, 2020–21
Bar graph showing sports injury hospitalisations by sport and sex in 2019 20. The viewer can view both males and females together or select one at a time. Cycling had the highest number of hospitalisations overall, and for males. Equestrian activities had the highest number of hospitalisations for females.
For more detail, see data table A28 and technical notes appendix table 3.
Rugby has the highest rate of hospitalisation
To evaluate the risk of injury for any sport, we can compare the reported number of injuries against the estimated number of participants. In 2020–21, rugby, wheeled motor sports, roller sports and equestrian activities had the highest injury hospitalisation rates (per 100,000 participants aged 15 and over) of all sports (Figure 11).
Figure 11: Rate per 100,000 participants (aged 15 and over) of injury hospitalisation, for selected sports categories, 2020–21
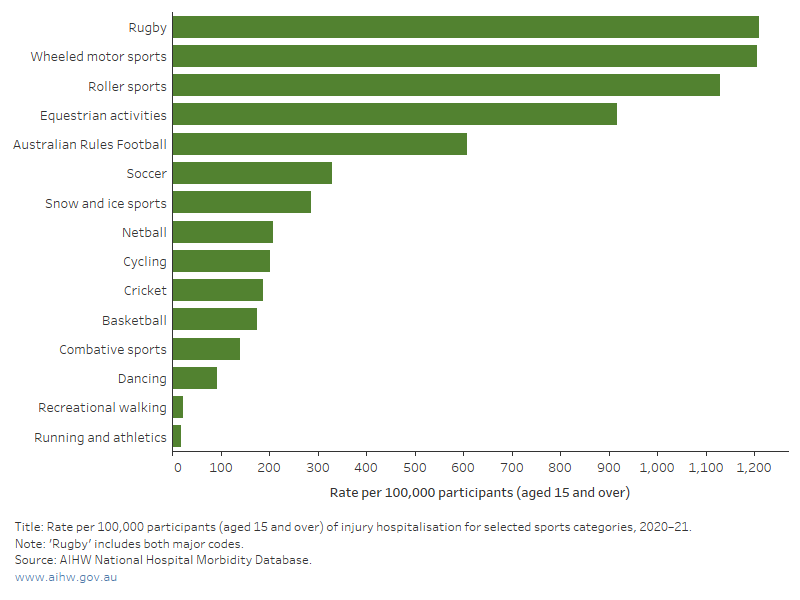
Note: 'Rugby' includes both major codes.
Source: AIHW National Hospital Morbidity Database.
For more detail, see data table A19.
Selected sports are featured in more detail on the next pages.