Technical notes
Data on health service use from datasets in the National Integrated Health Services Information Analysis Asset (NIHSI AA) were used to estimate health service use and costs for Australians in their last year of life. This section presents the methods for estimating the number of health services used, and corresponding costs.
About the National Integrated Health Services Information Analysis Asset
The NIHSI AA is an enduring linked data asset managed under the custodianship of the AIHW. It is available for analysis by the AIHW and participating jurisdictions for approved projects.
Data on service use, costs and deaths from the first iteration of NIHSI AA (version 0.5) were used to estimate health service use and calculate associated costs. Key datasets in the NIHSI AA version 0.5 used in this analysis were:
- National Death Index (NDI), which contains person-level cause of death information previously linked from the National Mortality Database (AIHW 2021a)
- National Medicare Benefits Schedule (MBS)
- National Pharmaceutical Benefits Scheme (PBS) and Repatriation Pharmaceutical Benefits Scheme (RPBS)
- Residential aged care data from the National Aged Care Data Clearinghouse
- Admitted patient care from the National Hospital Morbidity Database for public hospitals in New South Wales, Victoria, South Australia and Tasmania and some private hospitals in Victoria
- Non-Admitted Patient Emergency Department Care National Minimum Data Set for public hospitals in New South Wales, Victoria, South Australia, Tasmania.
Data was available between 1 July 2010 and 30 June 2017 for most datasets, except for deaths data which was available up to 31 December 2017.
NIHSI AA population and study groups
Overall, just under 26 million people were identified in the NIHSI AA version 0.5 (hereafter referred to as NIHSI AA) from records between 1 July 2010 and 31 December 2017. This is based on the Medicare Consumer Directory, a database of people enrolled in Medicare used in the creation of NIHSI AA, combined with 3 other main datasets – NDI, residential aged care data and hospitals data (admitted patient and emergency department care). All people in the Medicare Consumer Directory were first identified, which accounted for 97.8% of the NIHSI AA population. People not in the Medicare Consumer Directory but who appeared in hospital datasets accounted for an additional 2%. Those in the NDI and residential aged care data accounted for the remainder.
Study groups
In this study, the NIHSI AA population was divided into 2 study groups:
- People in the last year of life – includes people who had a death record in the NDI data between 1 July 2010 and 31 December 2017. Health service use in the 12 months before death was examined for each person and associated costs calculated.
- People not in the last year of life – includes people who did not have a death record in the NDI data between 1 July 2010 and 31 December 2017. Health service use between 1 July 2010 and 31 December 2016 was examined for each person and associated costs calculated.
The NIHSI AA comprises 4 core health and aged care service data (MBS, PBS/RPBS, residential aged care and hospital care) and deaths data (from the NDI). It therefore excludes people who did not use any of these services and/or did not have a death record in the NDI data at any point during the study period. Table A1 shows the numbers and proportions of the NIHSI AA population within each study group. Approximately 4% of people identified in the data were in their last year of life and 96% not in their last year.
Table A1: Cumulative population and percentage in each study group from records in NIHSI AA version 0.5
| Study group(a) | Total | Per cent (%) |
| People in the last year of life | 1,137,043 | 4.4 |
| People not in the last year of life | 24,736,845 | 95.6 |
| Total population in NIHSI AA | 25,873,888 | 100.0 |
(a) Population in scope are people identified in the National Integrated Health Services Information Analysis Asset version 0.5. The ‘last year of life’ group includes people who died between 1 July 2010 and 31 December June 2017. People not in the last year of life includes people without a death record between 1 July 2010 and 31 December 2017.
People in the last year of life
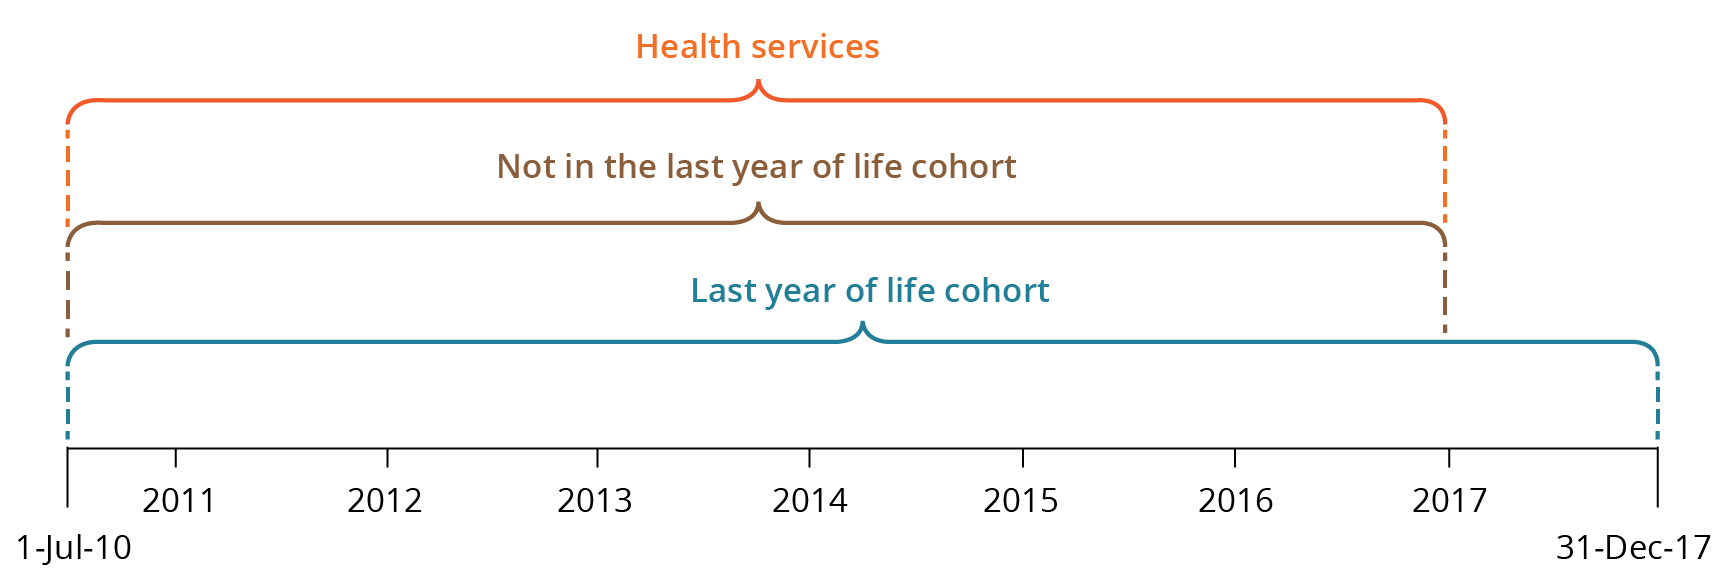
Health service use in the 12 months before death was retrospectively examined for people in their last year of life. Note that for health service use and costs for people who died in the first year of data, the study period will not cover a full 12 months before death. As a result, health service use and costs for people in their last year of life may be slightly underestimated. Figure A1 shows the time periods for the study cohorts and service use in scope.
People not in the last year of life
The number of health services used over the study period was examined for people not in their last year of life. Unlike the last-year-of-life group, which covers 7.5 years of NIHSI AA data, the study period for people not in the last year of life covers 6.5 years of data (between 1 July 2010 and 31 December 2016). For people not in the last year, service use between 1 January 2017 and 31 December 2017 was excluded because those who died in the following 12 months could not be identified.
Although the study periods for these 2 population groups are slightly different, they are mutually exclusive and useful comparisons can be made between the average number of health services used and associated costs for each group over 12 months.
Figure A1: Time period for study groups (whether in last year of life or not) and health service use
Identifying people who used residential aged care services
Health service use and costs over the study period (between 1 July 2010 and 31 December 2016) were disaggregated by whether a person used residential aged care services or not. This includes people living in permanent residential care and/or those who stayed one or more days in respite care over the study period.
Four comparison populations were derived:
1. People in the last year of life
- people who used residential aged care at any point during their last year of life
- people who did not use residential aged care in their last year of life
2. People not in the last year of life
- people who used residential aged care at any point during the study period
- people who did not use residential aged care during the study period.
Residential aged care data were only used to indicate whether people had used residential aged care or not. The care and support provided by residential aged care services directly are not captured in the 4 health service types examined.
Estimating age
The age of people in the study groups was based on when the person died and when they used a health or aged care service. These dates were used to first estimate single year ages of each person in the study groups.
For people in the last year of life, age at death was calculated by adjusting each person’s age at their first service in the linked data, by half a year. For example, if a person was recorded as being aged 84 at their first service, it was estimated that they were 84.5 years old, because there was no information on the number of days since their 84th birthday. Then the difference in years between the first service and when the person died was added to the adjusted age to derive single year of age for each person in their last year of life. For example, if the difference in years was
6.5 years, then the person was aged 91 when they died (84.5 years plus 6.5 years).
For people not in the last year of life, adjusted age at first linked service was added to the difference in years between the first and the last service used.
For people in the last year of life, information on the person’s sex and age at death was obtained from the NDI data because this was considered the most accurate source. For people not in their last year of life, information on the person’s sex and age at first service was obtained from other data sources.
For reporting purposes, health service use and cost estimates are reported in 10-year or broader age groups.
Estimating health service use and costs
The study examined 4 health service types: emergency department (ED) presentations; hospital admissions; MBS services; and prescriptions supplied under the PBS/RPBS. Different approaches were used to estimate costs and number of health services used by people in their last year of life and those not in their last year between July 2010 and December 2016.
Calculating National Weighted Activity Units for acute admitted hospital and ED services
The first approach involved calculating the National Weighted Activity Units (NWAUs) to derive a common unit against which costs can be applied for hospital use. NWAU is a measure of health service activity expressed as a common unit, against which the National Efficient Price (NEP) is paid. NWAU is a way of comparing and valuing each public hospital service (whether ED presentations, admissions or outpatient episodes), weighted for clinical complexity. NWAUs were calculated for acute admitted services and ED presentations. In this report, acute admitted services include mental health admissions. For more information on NWAUs see: https://www.publichospitalfunding.gov.au/calculation-national-weighted-activity-unit
Historical hospital utilisations of service categories (acute admitted and ED presentations), except for subacute, considered to have been funded under activity-based funding between 1 July 2010 and 31 December 2016 were converted into NWAUs. This was done using the Independent Hospital Pricing Authority (IHPA) NWAU16 calculators for acute admitted services and ED presentations.
NWAU16 calculators were selected as the most appropriate bases for standardising hospital uses because at the time of this analysis, the latest data available in NIHSI AA were for 2016–17 and for only 4 jurisdictions (New South Wales, Victoria, South Australia, and Tasmania). In addition, the IHPA 2016–17 NEP was selected and applied to estimate the cost of hospital utilisations. However, the AIHW has since updated the NIHSI AA (to version 1.0) to include 2018–19 data and for 6 jurisdictions (New South Wales, Victoria, South Australia, Tasmania, Queensland and the Australian Capital Territory).
To account for clinical complexity, NWAUs were derived at episode level by applying price weights and adjustments developed by the IHPA. Price weights for NWAU16 used include:
- Diagnostic Related Groups for acute admitted services
- Urgency Related Groups or Urgency Disposition Groups for ED presentations.
Adjustments for Indigenous status, radiotherapy, dialysis, and paediatric services were applied to acute admitted services and ED presentations to create a consistent, uniform set of service utilisations and costs, comparable across care types. For more information on IHPA’s NWAU16 calculators see: National Efficient Price Determination 2016-17 and Technical Specifications.
NWAUs derived in this study were compared with those published by the Administrator for 2015–16 and 2016–17. They were found to be slightly higher than those supplied by jurisdictions to the Administrator for payment purposes. This is because costs calculated for this study include the most recent data available.
After calculating NWAUs, the cost of hospital services (for acute admitted services and ED presentations) were calculated by multiplying the volume of weighted services by the 2016–17 NEP ($4,883 per NWAU). For more information see: IHPA’s determinations of the National Efficient Price is available in the National Efficient Price Determination 2016–17.
The costs estimated using this approach did not consider proportions of Australian Government and state and territory government contributions. Since the costs estimated are at national level, cross-border adjustments were not considered.
Estimating MBS services and prescriptions supplied under the PBS/RPBS
The second approach involved estimating the number of MBS services and number of prescriptions supplied under the PBS and RPBS, and their associated costs.
MBS items were mapped to broad type of service categories to obtain the total MBS services and total costs by broad type of service, such as un-referred (GP) attendances, specialist attendances and operations (Table A2). Fee charged, including patient co-payment, were used as the total cost of an MBS service. These estimates should be interpreted with caution due to data limitations that may have underestimated or overestimated the total cost of MBS services.