How healthy are Australia’s males?

Page highlights

  • Self-assessed health status
    3 in 5 (58%) of Australian males rate their health as excellent or very good.
  • Burden of disease
    Australian males lost more healthy years of life from dying prematurely (54%) than from living with disease and injury (46%).
  • Chronic conditions
    49% of Australian males have 1 or more of the 10 selected chronic conditions.
  • Cancer
    An estimated 89,000 new cancer cases will be diagnosed in males, in 2022.
  • Mental Health
    43% of Australian males have experienced a mental health problem at some point in their lifetime.
  • Dementia
    About 149,600 Australian males aged 30 and over are estimated to be living with dementia, the equivalent of 12 per 1,000 males.
  • Sexual health
    About 73,100 new cases of selected nationally notifiable sexually transmissible infections were reported for Australian males in 2021.
  • Life expectancy and mortality
    Australian males born in 2019–2021 can expect to live 30 years longer than males born in 1891–1900.

A person’s health status is a general measure combining physical, social, emotional and mental health and wellbeing. A person’s overall level of health can be measured through:

  • self-assessment
  • burden of disease analysis
  • the health impact of disease
  • injury in a population
  • presence of chronic conditions and comorbidities
  • mental health
  • sexual health
  • life expectancy.

Self-assessed health status

Self-assessed health status reflects a person’s perception of their own health at a particular point in time; it can give a broad picture of the population’s overall health (ABS 2018d).

In 2020–21, 58% of males rated their health as excellent of very good. The proportion of males who rated their health as excellent or very good varies by age group. Eight in 10 (80%) of males aged 15–24 rated their health as excellent or very good compared with 36% of males aged 75 and over in 2020–21 (ABS 2022d).

Burden of disease

Burden of disease quantifies the health impact of disease on a population in a given year – both from dying early and from living with disease or injury. The summary measure disability-adjusted life years (DALY) measures the years of healthy life lost from both premature death (fatal burden) and ill health (non-fatal burden).

In 2022 (AIHW 2022d):

  • Australian males experienced a greater share of ill health and death (53%) than females (47%)
  • after adjusting for age, males experience 1.2 times the rate of total burden and 1.6 times the rate of fatal burden of females, while rates of non-fatal burden are similar
  • Australian males lost more healthy years of life from dying prematurely (54%) than from living with disease and injury (46%)
  • the highest proportion of ill health and death for males was due to these top 5 disease groups: cancer (19%), cardiovascular diseases (14%), mental health conditions/substance use disorders (11%), injuries (11%), and musculoskeletal conditions (11%) (Figure 1)
  • males experienced a greater share than females of ill health and death from some disease groups including injuries (70%), kidney & urinary diseases (62%), cardiovascular diseases (60%), endocrine disorders (mostly diabetes) (58%), infant & congenital conditions (58%) and cancer (56%).

Figure 1: Leading causes of ill health and death (% DALY) by disease group, males, 2022
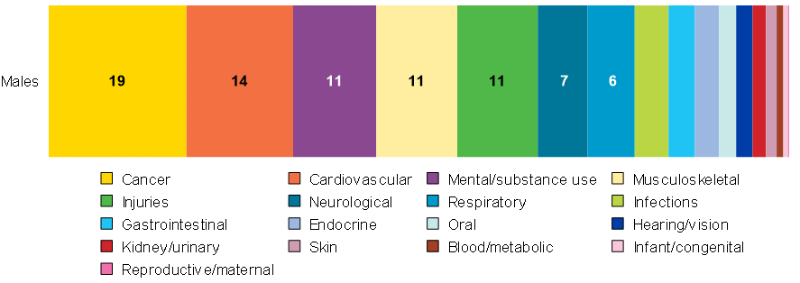
This chart represents the disease groups that contribute to ill health and death in males. Leading causes are cancer, cardiovascular diseases, mental health and substance use disorders, and injuries.

Notes:

DALY = Disability Adjusted Life-Year. This is a measure of healthy life lost, either through premature death or living with disability due to ill health. It is the basic unit used to measure the burden of a disease.

Source: AIHW analysis of AIHW 2022d

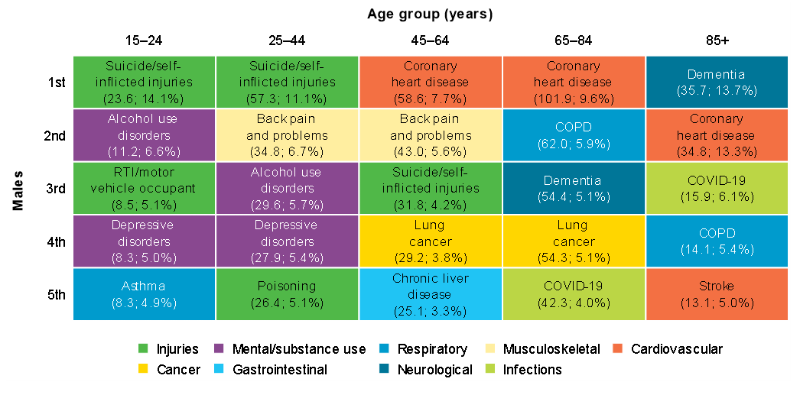
Ill health and death vary across age groups for males. Suicide and self-inflicted injuries were the leading cause of total burden for males aged 15–44. Alcohol use disorders was ranked second for total burden among males aged 15–24, with back pain second among those aged 25–44. Coronary heart disease was the leading cause of burden among males aged 45–84, and second for those aged 65 and over. COVID-19 features for the first time in the top 5 leading causes for males aged over 65 (Figure 2) (AIHW 2022d).

For more information see Australian Burden of Disease Study 2022.

Figure 2: Leading causes of ill health and death (DALY'000; proportion %) among males aged 15 and over, 2022

This figure shows the leading causes of ill health and death for males aged 15 and over, and that suicide, depressive and alcohol disorders affect younger age groups compared to older age groups where dementia and coronary heart disease are leading causes.

DALY = Disability Adjusted Life-Year.

Notes:

  1. RTI = road traffic injury, COPD = chronic obstructive pulmonary disease.
  2. Disease rankings exclude ‘other’ residual conditions from each disease group; for example, ‘other musculoskeletal conditions’.

Source: AIHW analysis of AIHW 2022d

Chronic conditions

Chronic conditions pose significant health problems and have a range of potential impacts on individual circumstances. Data in this section focus on 10 common chronic conditions including:

For more information see Chronic conditions.

Among Australian males aged 15 and over, 49% are estimated to have one or more of the 10 selected common chronic conditions. About 1 in 3 (29%) males aged 15 and over have one, 13% have 2, and 6.8% have 3 or more (ABS 2022c). Prevalence of the 10 selected conditions is shown in Table 1 (ABS 2022d, AIHW 2022g).

The self-reported prevalence of chronic conditions increases with age (ABS 2022d):

  • Almost 3 in 10 (37%) of males aged 15–44 have at least one chronic condition.
  • 53% of males aged 45–64 have at least one chronic condition.
  • 74% of males aged 65 and over have at least one chronic condition.
Table 1: Number and percentage of selected chronic conditions, males aged 15 and over, 2020–21(1)
Condition Number Percentage2
Back problems3 1,884,500 19
Mental and behavioural conditions4 1,792,200 18
Arthritis5 1,275,700 13
Asthma 936,700 9.4
Diabetes mellitus6 705,400 7.1
Heart, stroke and vascular disease7 605,500 6.1
Cancer 268,500 2.7
Osteoporosis8 139,900 1.4
Kidney disease 124,900 1.3
Chronic obstructive pulmonary disease (COPD)9 108,700 1.1

Notes

  1. This data is self-reported and likely under-reports the true prevalence of chronic conditions.
  2. Percentages is calculated out of the total male population aged 15 and over.
  3. Includes sciatica, disc disorders, back pain/problems not elsewhere classified and curvature of the spine.
  4. Includes harmful use or dependence on alcohol and/or drugs, mood (affective) disorders, anxiety related disorders, organic mental disorders and other mental and behavioural conditions.
  5. Includes rheumatoid arthritis, osteoarthritis, other and type unknown.
  6. Includes Type 1 and Type 2 diabetes mellitus and type unknown. These estimates include persons who reported they had diabetes mellitus but that it was not current at the time of interview.
  7. Includes angina, heart attack, other ischaemic heart diseases, stroke and other cerebrovascular diseases, oedema or heart failure, and diseases of the arteries, arterioles and capillaries. Estimates include persons who reported they had angina, heart attack, other ischaemic heart diseases, stroke and other cerebrovascular diseases or heart failure but that these conditions were not current at the time of interview.
  8. Includes osteopenia.
  9. Includes chronic bronchitis, emphysema and chronic airflow limitation. Asthma is reported separately.

Source: ABS 2022d, AIHW 2022g

For more detailed information about chronic conditions, see Chronic conditions.

Cancer

In 2022, the estimated number of new cancer cases in males of all ages is around 89,000, which accounts for 55% of all cases. The most common cancer diagnosis in males is prostate cancer, followed by melanoma of the skin, colorectal cancer, and lung cancer (AIHW 2022f). The risk for Australian males of being diagnosed with cancer is 1 in 3 by the age 75, and 1 in 2 by age 85 (AIHW 2019).

The most common cancer diagnosis among males varies by age. In 2022, leukaemia and brain cancer were the most common for males aged under 20. Testicular cancer and melanoma were the most common in males aged under 40, with prostate cancer and melanoma the most common in males aged over 40. The estimated age–specific incidence of all cancers increases sharply from age 45, and the associated mortality rate is delayed and increases sharply from age 65 (Figure 3) (AIHW 2022f).

Figure 3: Estimated age-specific incidence and mortality rate for all cancers, males, 2022

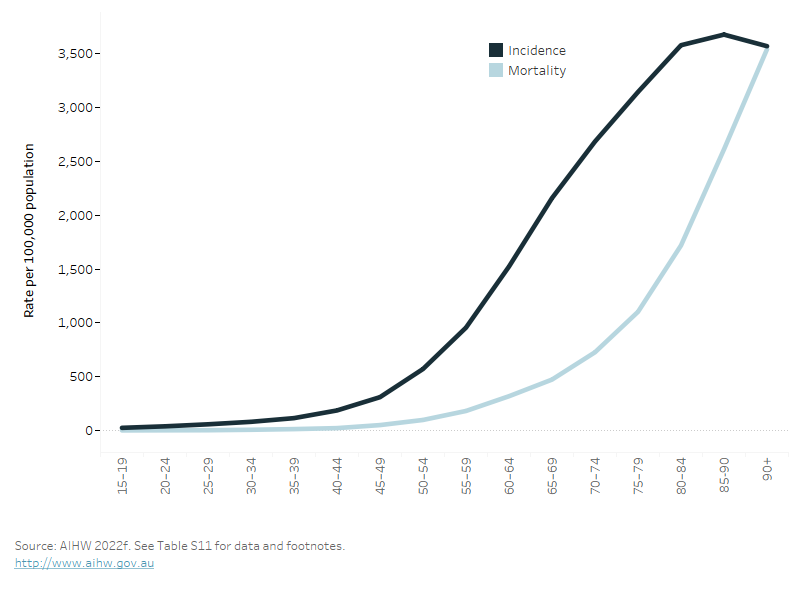
The figure shows that the incidence of all cancers increases with age, as does the associated mortality. However, mortality is delayed due to the period of living with cancer.

Mental health

A lifetime mental health disorder refers to people who met the diagnostic criteria for having a disorder at some time in their life. This does not imply that a person has had a disorder throughout their entire life. Based on the 2020–21 National Study of Mental Health and Wellbeing (NSMHW) (ABS 2022h):

  • 43% of males aged 16–85 report having a mental disorder at some point in their lifetime
  • 22% of males report having an anxiety related and substance use (27%) disorders.

A 12-month mental health disorder refers to the people who met the diagnostic criteria for having a disorder at some time in their life and had sufficient symptoms of that disorder in the 12 months prior to the survey.

Based on the 2020–21 NSMHW, for males aged 16–85 (ABS 2022h):

  • around 18% had any 12-month mental disorder
  • just over 1 in 10 (12%) reported having a 12-month anxiety-related disorder
  • 12-month mental health disorders varied by age, with 31% of males aged 16–24 having a 12-month mental health disorder, compared with 22% of those aged 25–44, and 10% of those aged 65–74.

For more information of the mental health of Australians, see Mental health services.

Dementia

Dementia is a significant and growing health and aged care issue in Australia. It has substantial impact on the health and quality of life of males with this condition, as well as on their family and friends. Dementia is the 5th leading causes of ill health and premature death in males of all ages and becomes the number one leading cause in males aged 85–99 (AIHW 2023c). Dementia is the second leading cause of death in males overall, accounting for 6.8% of all male deaths in 2020.

Estimates indicate that about 149,600 Australian males aged 30 and over are living with dementia in 2022, which is equivalent to 12 males with dementia per 1,000 males. This estimate is projected to increase to 315,000 in 2058 (AIHW 2023d).

Age is a main risk factor for dementia with the estimated prevalence of men living with dementia increasing as aged increase (Figure 4) (AIHW 2023c). Other modifiable risk factors recognised as having strong evidence for increased risk of developing dementia include low level of education in early life and hearing loss in midlife (AIHW 2023c).

The 2 leading health risk factors measured by the Australian Burden of Disease Study for dementia are overweight (including obesity) and physical inactivity, contributing 20% and 11%, respectively to the total burden due to dementia (AIHW 2023d).

For more information on Dementia and its associated risk factors, see Dementia in Australia.

Figure 4 Prevalence of dementia by age group (per 1,000 population), males, 2022

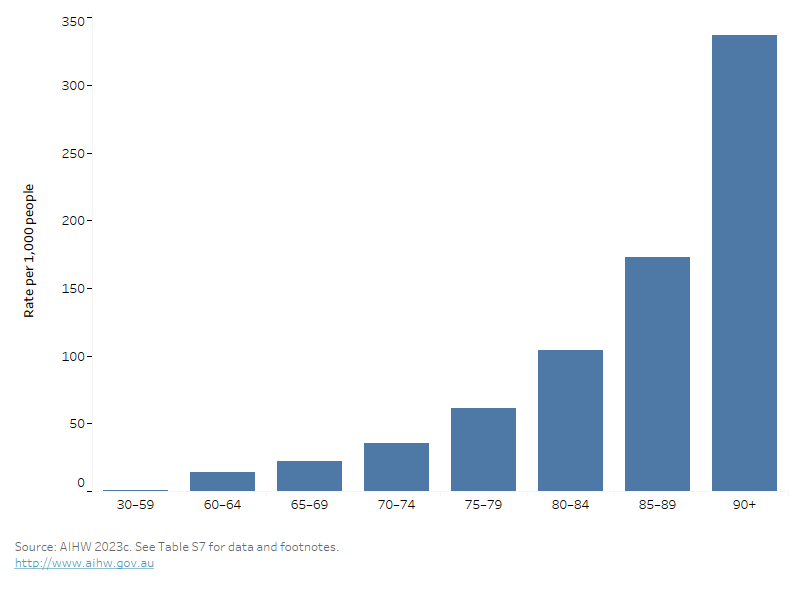
This bar chart shows the rate of dementia across age groups, with the prevalence increasing with age and highest in those aged 90 and over.

Sexual health

Sexual health is a state of physical, mental and social well-being in relation to sexuality. Measures of sexual health include the prevalence of sexual difficulties and sexually transmissible infection rates (WHO 2022a).

Sexual difficulties

A study published in 2016 indicated that more than half (54%) of males aged 18–55 had experienced some sexual difficulty lasting at least 3 months in the last 12 months, in 2013–2014 (Schlichthorst, et al. 2016).

Of these males (Table 2):

  • around 2 in 5 (37%) reported ‘reaching climax too quickly’
  • around 1 in 5 (17%) reported ‘lacked interest in having sex’.

‘Reaching climax too quickly’ was the most common issue across all age groups (between 32% and 39%).

Other types of sexual difficulty differed by age (Schlichthorst, et al. 2016):

  • ‘did not reach climax or took a long time’ was the next most common issue in males aged 18–24
  • ‘lacking interest in having sex’ was most common among males in aged 45–55.
Table 2: Type of sexual difficulty experienced by males aged 18–55 who experienced at least 1 sexual difficulty(1) in the past 12 months, 2013–2014
Type of sexual difficulty (SD) Total yes (%) 95% CI
At least one SD over the past 12 months 54.2 53.3–55.1
Reached climax too quickly 37.2 36.4–38.1
Lacked interest in having sex 17.3 16.6–17.9
Did not reach climax or took a long time 15.0 14.3–15.6
Had trouble getting or keeping an erection 13.7 13.1–14.3
Felt anxious during sex 10.9 10.4–11.5
Lacked enjoyment in sex 10.1 9.6–10.6
Felt no excitement or arousal during sex 6.0 5.5–6.4
Felt physical pain as a result of sex 3.7 3.4–4.0

Notes:

  1. Sexual difficulty experienced for at least three months in the 12 months before the study.
  2. 95% CI = 95% confidence interval. We can be 95% confident that the true value is within this range of values. 

Source: Schlichthorst, et al. 2016.

Sexually transmissible infections

Sexually transmissible infections (STIs) are a subset of communicable diseases known to be transmitted through sexual contact. More than 30 different viruses, bacteria and parasites are known to be transmitted sexually (WHO 2022b). Although some STIs can be cured, a person can have an STI without symptoms of disease. If left untreated, these infections can have serious consequences for long-term health.

Nationally notifiable diseases which are sexually transmissible include chlamydia, gonococcal infection, syphilis, human immunodeficiency virus (HIV), donovanosis, hepatitis B and hepatitis C. It should be noted that HIV, hepatitis B and C are also transmissible via other routes such as exposure to unsafe injecting drug use.

In 2021, there were about 73,137 notifications of chlamydia, gonococcal infection, syphilis, hepatitis B and hepatitis C for males, which accounted for 56% of all notifications in both males and females for these selected STI’s (Table 3) (DoHAC 2022).

In 2021, there were 486 new cases of HIV among males. After adjusting for age, the rate of HIV notifications decreased by 55% since 2012. The declines seen between 2019 and 2021 are likely attributable in part to the impact of COVID‑19 restrictions on social activity, healthcare access and testing, and travel (UNSW 2022).

Table 3: Number, proportion and rate of selected sexually transmitted infection notifications, males, 2020 and 2021

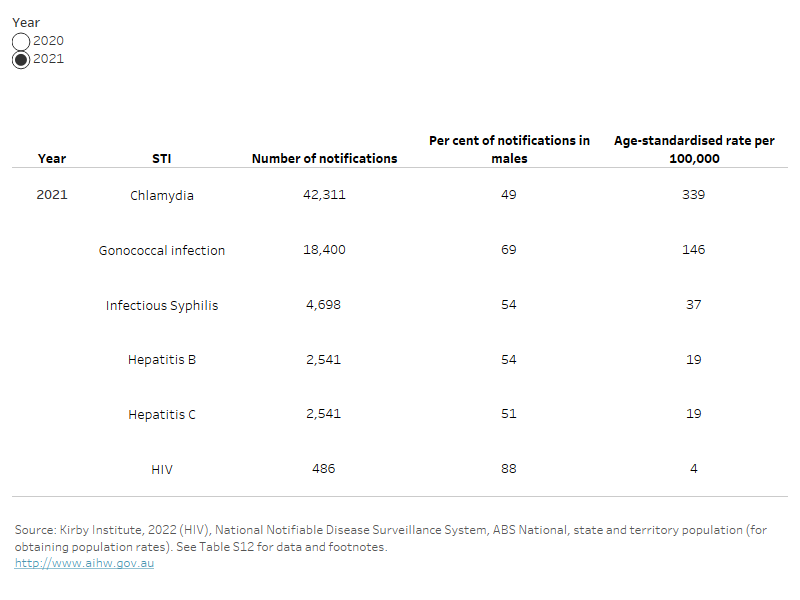
This table shows the number of notifications, per cent of total cases, and age-standardised rates of notifications for chlamydia, gonococcal infection, syphilis, hepatitis b and c for the years 2020 to 2022. For HIV, only 2020 and 2021 data are available. 

Notes:       

  1. Total excludes cases where sex was missing.
  2. Hepatitis B and C notifications include newly acquired and unspecified cases and could have been transmitted through other routes.
  3. Syphilis notifications include syphilis of less than 2 years duration (infectious) and excludes syphilis of more than 2 years or unknown duration (unspecified).
  4. There are no new cases of donovanosis reported in males in 2020 and 2021.

After adjusting for age, notification rates in males for viral hepatitis B and hepatitis C have decreased by 39% and 29%, respectively, from 2012 to 2022. In 2021, rates for hepatitis B are the highest among males aged 30–39 (36 per 100,000 population). For hepatitis C, rates are the highest in males aged 25–29 (74 per 100,000 population) (DoHAC 2022).

After adjusting for age, there has been an increase in rates of chlamydia, gonococcal infections and syphilis notifications since 2012, peaking in 2019 and then decreasing in 2020 and 2021 which is likely related to the COVID‑19 pandemic, and may not be reflective of the trend in new infections (Figure 5). Rates of notifications have increased from 2021 to 2021 for all three infections (Figure 5). Chlamydia is the most frequently notified STI in Australia in both males and females.

After adjusting for age, compared with 2012, rates of these infections in 2021 for males were (DoHAC 2022):

  • 3.0 times higher for syphilis, with the highest rate seen in males aged 30–39
  • 1.7 times higher for gonococcal infections, with the highest rate seen in males aged 25–29
  • 1.1 times as high for chlamydia, with the highest rate seen in males aged 20–24.

Figure 5: Age-standardised rate per 100,000 of gonococcal, syphilis and chlamydia notifications, males, 2012–2021

The line graph shows the notification rates for chlamydia, gonorrhoea and syphilis across the years, from 2012 to 2022. It shows an increase in rates for all three infections.

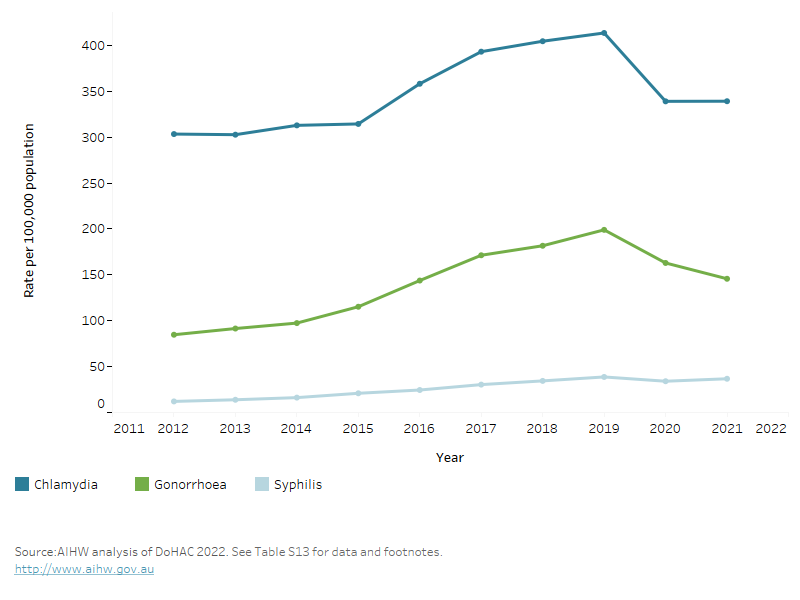
For more information, see HIV, viral hepatitis and sexually transmissible infections in Australia: Annual surveillance report 2022, and the Department of Health and Aged Care National Notifiable Disease Surveillance System.

For more information on male sexual health, see the Healthy Male organisation website Healthy Male Australia: Generations of healthy Australian men.

Life expectancy and mortality

Life expectancy is expressed as either the number of years a newborn baby is expected to live, or the expected years of life remaining for a person at a given age.

This chart shows life expectancy for males in the year 1900 and 2021. It shows that life expectancy increased from 51.1 years in 1900 to 81.3 in 2021.

Source: AIHW 2022h

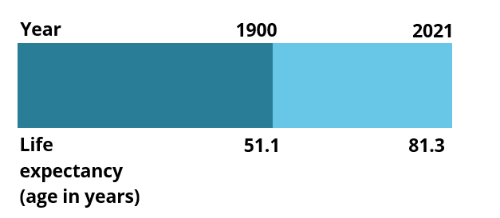
Life expectancy at birth in Australia has improved dramatically in the last century, and males born in 2019–2021 can expect to live 30 years longer than males born in 1891–1900 (ABS 2022h):

  • Males born in Australia in 2019–2021 can expect to live to the age of 81.3 years on average (an increase of 1.6 years in the past 10 years) (ABS 2022f).
  • International comparisons of life expectancy at birth for males in 2021 indicate that Australian males have the sixth highest life expectancy in the world (81.2 years). Switzerland is ranked first with 81.9 years (OECD 2021).

For more information see: Deaths in Australia: Life expectancy.

Health Adjusted Life Expectancy

Health Adjusted Life Expectancy (HALE) reflects the length of time an individual at a specific age could, on average, expect to live in full health. It can be measured at any age but is typically reported:

  • from birth
  • at age 65, describing health in an ageing population.

Life expectancy for males born in 2022 is 81.2 years, while the average number of healthy years for these babies is 71.6 years (AIHW 2022d). The difference between life expectancy and HALE (that is, the time expected in less than full health) is 9.6 years. This means that males can expect to spend 88% of their lives in full health (AIHW 2022d).

Males born in 2022 are expected, on average, to live 4.1 years less than females, and are expected to have 2.5 less years of healthy life than females (AIHW 2022d).

Life expectancy in 2022 for males aged 65 was 20.3 years; that is, they could expect to live to the age of 85. At age 65, males could expect on average 15.3 healthy years of life and 5.0 years in less than full health (AIHW 2022d).

Between 2003 and 2022, life expectancy and HALE at birth increased for males. Males gained 3.1 years in life expectancy (from 78.1 years in 2003 to 81.2 in 2022) and 2.2 years in HALE (from 69.4 to 71.6 years) (AIHW 2022d).

For more information see: Australian Burden of Disease Study 2022.

Mortality

Looking at how many people die and what caused their deaths can provide vital information about the health of a population. Patterns and trends in deaths can help explain differences and changes in the health of a population (AIHW 2022h).

Causes of death can be used to:

  • assess the success of interventions to improve disease outcomes
  • signal changes in community health status and disease processes
  • highlight inequalities in health status between population groups.

In 2021, around 89,400 Australian males died. The median age at death was 79.6 years and the leading cause of death was coronary heart disease (12%), followed by dementia including Alzheimer’s disease (6.3%), and lung cancer (5.6%) (Figure 6). The leading causes of death varied by age group (Figure 7) (AIHW 2021a).

The median age at death for males also varies by population group:

  • It decreases from 80 years old in Major cities to 66 in Very remote areas (AIHW 2022k).
  • It decreases from 81 years in the highest socioeconomic areas, to 77 in the lowest socioeconomic areas (AIHW 2022l).

For more information see Deaths in Australia: Life expectancy.

Figure 6: Leading causes of death, males of all ages, 2021

This horizontal bar chart shows the leading causes of death in males. Leading causes of death include coronary heart disease, dementia including Alzheimer's disease and lung cancer. 

Notes

  1. Year refers to year of registration of death. Deaths registered in 2021 are based on the preliminary version of cause of death data and are subject to further revision by the Australian Bureau of Statistics (ABS).
  2. Rates are calculated using the sum of estimated resident populations at 30 June for each year. Estimated resident populations for 2020 and 2021 have been impacted by COVID-19.
  3. Leading causes of death are based on underlying causes of death and classified using an AIHW-modified version of Becker et al. 2006. A method for deriving leading causes of death. Bulletin of the World Health Organization 84: 297–304. International Statistical Classification of Diseases and Related Health Problems, 10th revision.
  4. International Statistical Classification of Diseases (ICD-10) codes are presented in parentheses.

Figure 7: Leading 3 underlying causes of death (number, %), by age group (years), males, 2019–2021

This horizontal bar chart shows the top three causes of death in rank order, and the changes with increasing age groups. Suicide affects younger age groups while coronary heart disease is ranked as the leading cause of death for those aged 45 and over.

Notes

  1. Year refers to year of registration of death. Deaths registered in 2019 are based on the revised version, deaths registered in 2020 and 2021 are based on the preliminary version. Revised and preliminary versions are subject to further revision by the Australian Bureau of Statistics.
  2. Leading causes of death are based on underlying causes of death and classified using an AIHW-modified version of Becker et al. 2006.
  3. Data by causes of death have been adjusted for Victorian additional death registrations in 2019. A time series adjustment has been applied to causes of death to enable a more accurate comparison of mortality over time. When the time series adjustment is applied, deaths are presented in the year in which they were registered (that is, removed from 2019 and added to 2017 or 2018). For more details, please refer to Technical note: Victorian additional registrations and time series adjustments in Causes of death, Australia, 2019 (ABS Cat. no. 3303.0). 
  4. Per cents have been calculated using the adjusted number of deaths due to all causes (see note 2) as the denominator, however the number of deaths due to all causes presented in the table have not been adjusted.

Premature and potentially avoidable deaths

Premature deaths are deaths occurring before the age of 75. Four in 10 (40%) of all deaths are premature in males, and males account for 62% of all premature deaths. The proportion of premature deaths and the premature mortality rate varies by population groups. After adjusting for age, which removes the effects of age when comparing rates between population groups with different age structures (AIHW 2022j):

  • About 7 in 10 (70%) deaths in Very remote areas are premature, compared to around 4 in 10 (39%) in Major cities.
  • The premature mortality rate increases as remoteness increase, with rates in Very remote areas 1.8 times higher (400 deaths per 100,000 people) than the rate in Major cities (220 per 100,000).
  • Over 4 in 10 (44%) deaths in the lowest socioeconomic area are premature, compared with 34% in the highest socioeconomic area.
  • The premature mortality rate in the lowest socioeconomic area was also twice as high (343 deaths per 100,000 people) as the highest socioeconomic area (159 per 100,000).

Potentially avoidable deaths refer to deaths before the age of 75 from conditions that are potentially preventable through individualised care and/or treatable through existing primary or hospital care. Potentially avoidable deaths account for 20% of total deaths in males, and 51% of all premature deaths in males. The proportion of premature deaths that are potentially avoidable and the rate of potentially avoidable deaths generally differed between population groups. After adjusting for age:

  • Males in Very remote areas had a higher proportion of premature deaths that are potentially avoidable (58%), compared to males in Major cities (50%). The rate of potentially avoidable deaths in Very remote areas (235 deaths per 100,000 people) is over twice the rate in Major cities (111 per 100,000 people).  
  • The proportion of premature deaths that are potentially avoidable did not differ between the lowest and the highest socioeconomic area. However, males in the lowest socioeconomic areas had twice the rate of potentially avoidable deaths per 100,000 population compared with males in the highest socioeconomic areas (182 and 82 per 100,000 respectively).

For more information see: Mortality Over Regions and Time.