Health behaviours and risk factors of Australia's males
A person’s health and wellbeing are influenced by many factors, including individual health behaviours, societal and socioeconomic factors. A lifestyle including physical activity, a well-balanced diet, a safe occupation and maintaining a healthy body weight reduces the risk of poor health. Risk factors such as smoking tobacco, alcohol consumption, using illicit substances or being exposed to violence, increase the likelihood of poor health.
Around 40% of ill health and premature death in Australian males was potentially preventable in 2018 – that is, it could have been potentially prevented had exposure to certain risk factors been reduced or avoided (AIHW 2023a).
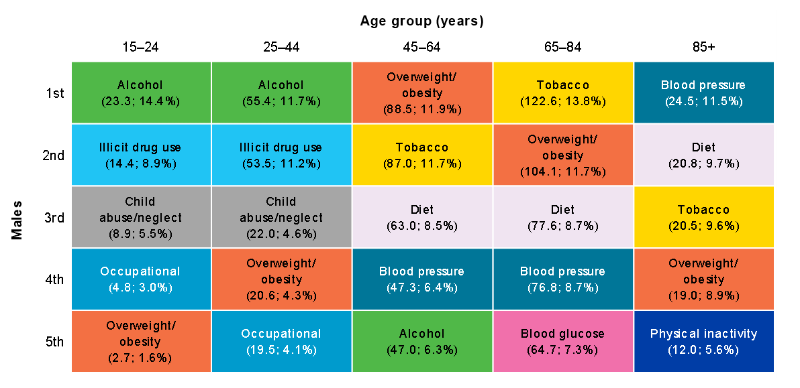
The leading risk factors contributing to ill health and premature death in Australia among males were tobacco use, overweight (including obesity), all dietary risks, alcohol and illicit drug use in 2018 (AIHW 2021b). Risk factors that have the most impact on the burden of disease for males vary across age groups (Figure 8).
For more information see Burden of disease.
Figure 8: Leading risk factor contribution to ill health and premature death (attributable DALY per 1,000 population; proportion of DALY), males aged 15 and over, 2018
Notes:
- For age groups under 25, many risk factors were not measured due to data limitations of linked diseases among these age groups.
- DALY = Disability Adjusted Life-Year.
- Partner violence = Intimate partner violence; Blood glucose = High blood glucose; Blood pressure = High blood pressure; Occupational = occupational exposures and hazards
Source: AIHW analysis of AIHW 2021b
Tobacco smoking
Tobacco is a leading preventable cause of ill health and premature death for males, responsible for 9.2% of total burden of disease in Australia in 2018. Tobacco is linked to a number of common and serious health conditions including cancer, cardiovascular diseases, and respiratory diseases such as chronic obstructive pulmonary disease and asthma (AIHW 2021b).
Tobacco use contributed to about 12,000 deaths among males (14% of all male deaths) in 2018 (AIHW 2021b). The burden of tobacco use was 3 times higher in the lowest socioeconomic areas when compared with the highest areas (AIHW 2021b).
The latest data pooled from multiple ABS surveys report that 12% of males are current daily smokers, while 1.4% are current smokers who smoke less than daily (ABS 2022e).
Smoking rates for current daily smokers varies by age group among males, peaking in the age group of 55–64 at 16%, with rates being lowest in males aged 15–17 years (2.4%) (Figure 9).
The proportion of males who smoked daily varies by population groups. After adjusting for differences in age structure:
- males living in the lowest socioeconomic area were 3 times as likely to smoke daily as males in the highest area (26% and 8.7%, respectively) in 2017–18 (Figure 10) (ABS 2019)
- males living in Outer regional and remote areas were 1.5 times as likely to smoke daily as males in Major cities (24% and 16%, respectively), in 2017–18 (Figure 10) (ABS 2019)
- Aboriginal and Torres Strait Islander males aged 15 and over were 2.5 times as likely to smoke daily as non-Indigenous males, with 40% of Indigenous males aged 15 and over smoking daily, according to 2018–19 data (AIHW 2020a)
- the proportion of Indigenous males who are current smokers was the highest in Remote and very remote areas (62%) compared with non-remote areas, such as Major cities (29%), Inner regional areas (40.2%) and Outer regional areas (55%) (AIHW 2020a).
Figure 9: Daily smoking status of current smokers by age group (percentage), males aged 15 and over, 2020–21
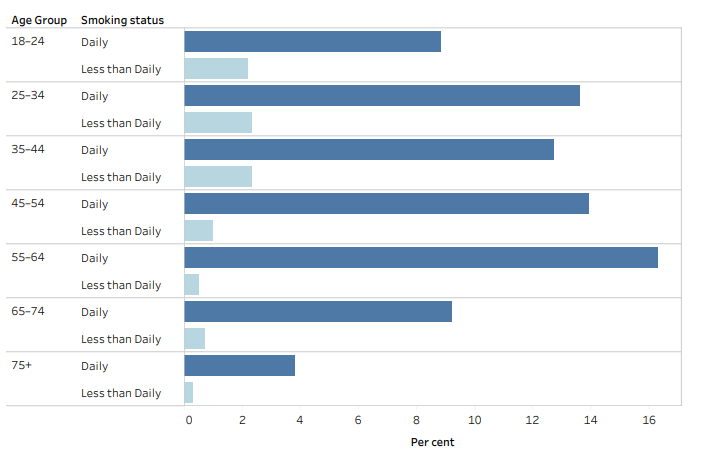
Source: ABS 2022e. See Table S8 for data and footnotes.
Figure 10: Daily smoking by socioeconomic and remoteness areas (percentage), males aged 18 and over, 2017–18
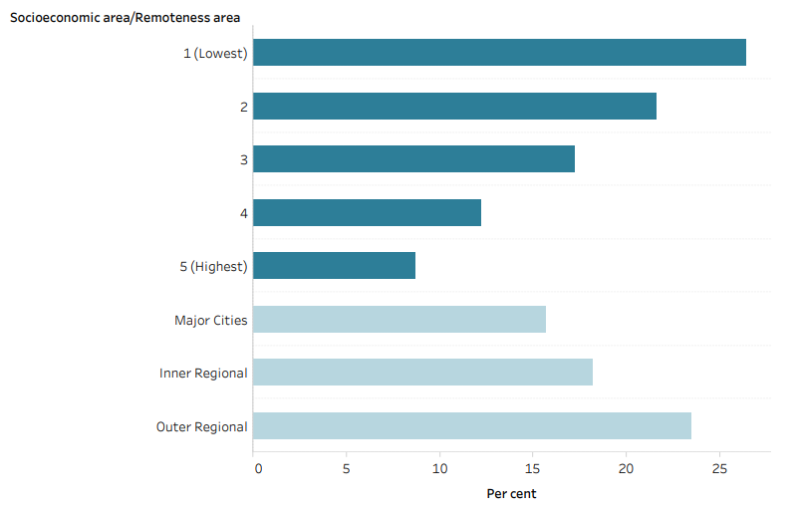
Source: ABS 2019. See Table S8 for data and footnotes.
Electronic cigarettes/e-cigarettes or vapes
Electronic cigarettes/e-cigarettes or vapes are the most common alternative inhaled nicotine delivery system (DoHAC 2012). These devices contain nicotine, flavourings and other chemicals which is turned into a vapour, rather than smoke, and inhaled by the user.
In 2020–21, around 11% of males used an e-cigarette or vaping device at least once in their lifetime (ABS 2022l). Just over 1 in 5 of males aged 18–24 (20%) and 25–34 (22%) had tried an e-cigarette or vaping device, the highest among male age groups.
Around 2.9% of males currently use and e-cigarette or vaping device in 2020–21. Males aged 18–35 have the highest proportions of those currently using an e-cigarette or vaping device at 5.1% (ABS 2022l).
Alcohol
Alcohol was the 4th leading preventable cause of ill health and premature death in males, responsible for 6.1% of total disease burden in 2018. Alcohol use is linked to chronic liver disease, accident and injury, such as motor vehicle accidents, self-inflicted injuries, physical violence and homicide.
Alcohol use contributed to around 4,100 deaths in males (4.9% of all male deaths). The burden of alcohol use was 1.9 times higher in males from the lowest socioeconomic areas when compared with males from the highest areas (AIHW 2021b).
To reduce the risk of harm from alcohol-related disease or injury, it is recommended that healthy males should drink no more than 10 standard drinks a week and no more than 4 standard drinks on any one day. The less you drink, the lower your risk of harm from alcohol (NHMRC 2020).
Reporting against these guideline recommendations, in 2020–21 (ABS 2022i):
- 27% of males exceed the guideline by consuming more than 10 standard drinks per week, and of these 81% consumed 14 drinks or more.
- 24% of males exceeded the guideline by consuming 5 or more standard drinks on a single day, at least monthly in the last 12 months.
- The percentage of males who exceed 10 standard drinks per week is highest in those aged 45–54 (32%) and 55–64 (32%), while the percentage who exceed 5 drinks on a single day at least monthly is highest in those aged 25–34 (29%) (Figure 11).
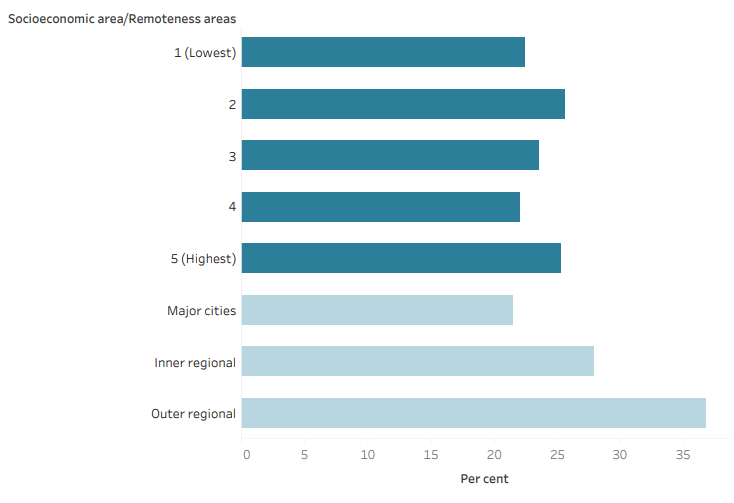
After adjusting for differences in age structures, the proportion of males exceeding the lifetime alcohol risk guidelines (drinking more than 2 standard drinks per day) is (Figure 12) (AIHW 2022a):
- similar between the lowest and highest socioeconomic areas, based on the 2017–18 NHS
- is 1.7 times higher in males living in Outer regional and remote areas (37%) compared with males living in Major cities (22%).
For more information see Alcohol.
Figure 11: Alcohol drink consumption by age group and number of drinks (percentage) against the recommended guidelines, males, 2020–21
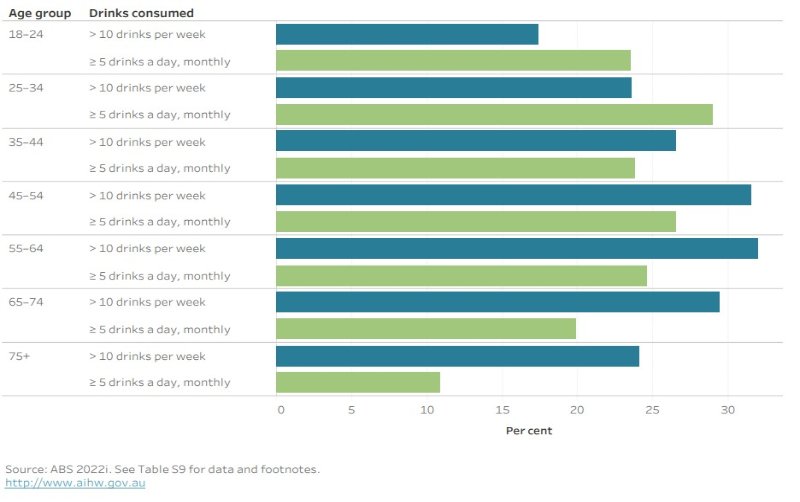
Source: ABS 2022i. See Table S9 for data and footnotes.
Figure 12: Lifetime alcohol use risk by socioeconomic and remoteness areas (percentage), males, 2017–18
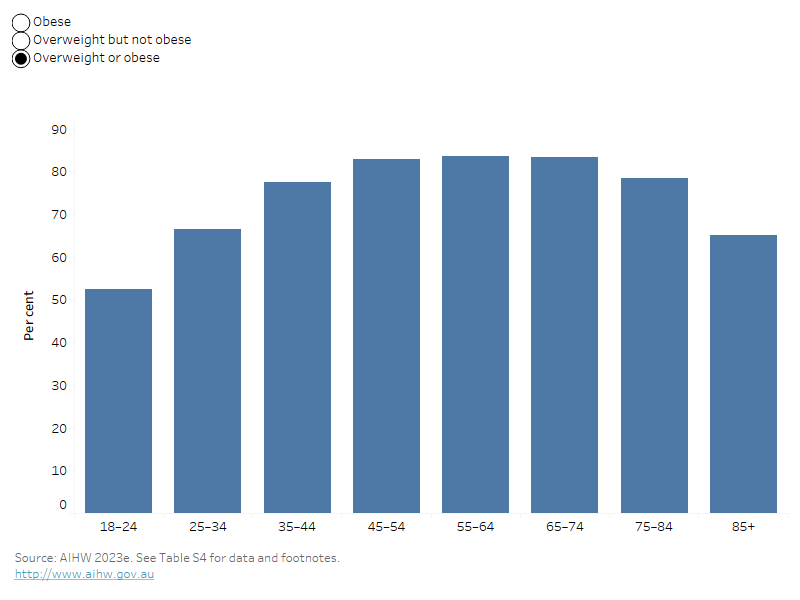
By selecting the various weight classifications in this bar chart, the prevalence of the individual classification will be shown across age groups.
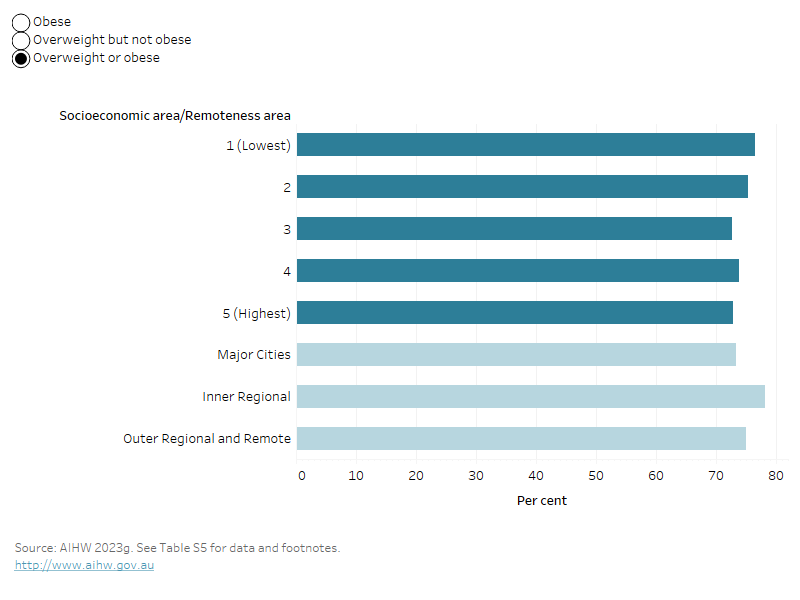
By selecting the various weight classifications in this bar chart, the prevalence of the individual classification will be shown across different socioeconomic and remoteness areas.
Waist circumference
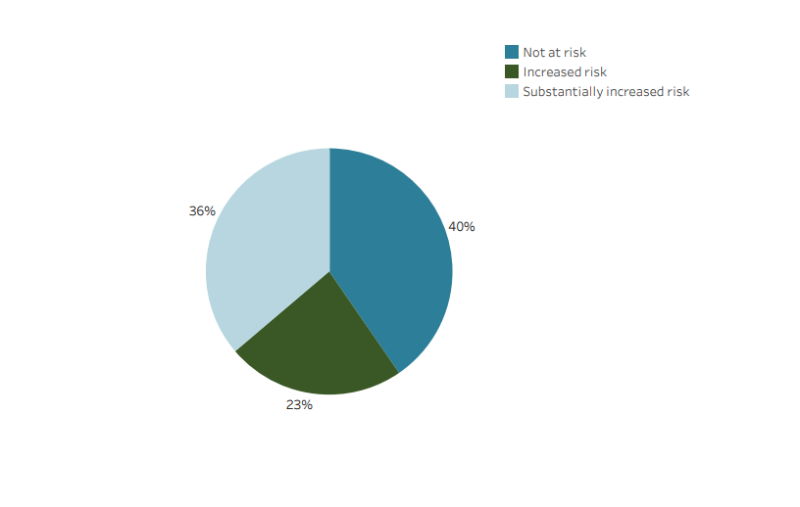
Waist circumference is another common measure of overweight and obesity. For males, a waist circumference above 94cm is associated with an increased risk of metabolic complications, and above 102cm a substantially increased metabolic risk (AIHW 2023f).
Among Australian males, about 3 in 5 (60%) have a high-risk waist circumference; that is, one associated with an increased or substantially increased risk of metabolic complications (Figure 15). The average waist circumference for males in 2017–18 is 98cm (ABS 2018c).
High-risk waist circumference was more common in older males and increased with age:
- 57% of males aged 65–74 had a waist circumference greater than 102cm, placing them at substantially increased metabolic risk.
- 14% of men aged 18–24 and 43% of men aged 45–54 had substantially increased risk.
Figure 15: Waist circumference by health risk category (percentage), males, 2017–18
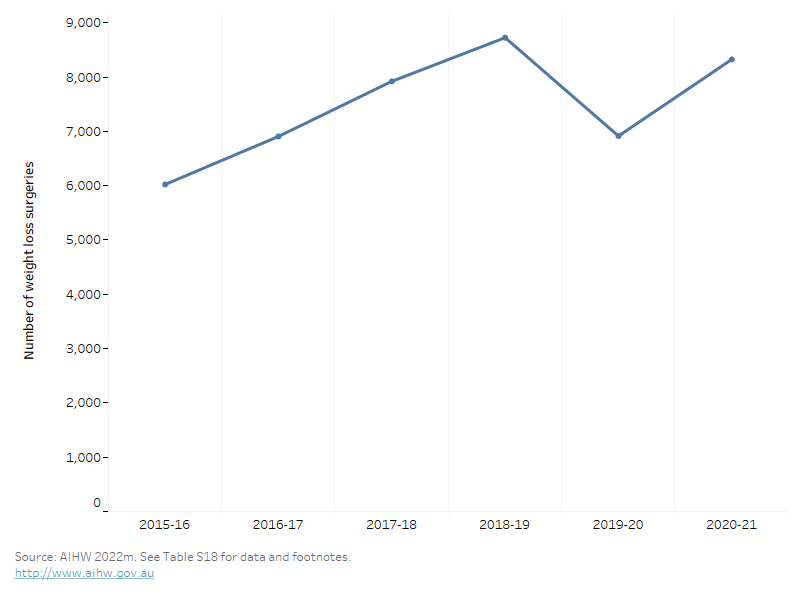
This line graph shows that weight loss surgeries had been increasing over time until 2019-20 when there was a decrease, possibly due to pandemic restrictions, however this recovered quickly as restrictions eased.
Diet
Dietary risk factors were the 3rd leading preventable cause of ill health and premature death for males, responsible for 6.6% of ill health and premature death in Australia in 2018. ‘All dietary risks’ include components where adequate amounts in the diet are required to prevent disease, and diets where excessive consumption contributes to disease development. The 12 individual dietary risks are:
- a diet low in: fruit and vegetables, milk, nuts and seeds, whole grains and high fibre cereals, legumes, polyunsaturated fat, and fish and seafood
- a diet high in: sodium, sugar-sweetened beverages, and red and processed meats.
All dietary risks contribute to 52% of coronary heart disease, 28% of stroke, 26% of type 2 diabetes, 26% of bowel cancer and 23% of oesophageal cancer.
All dietary risks contribute to about 8,900 deaths (11% of all male deaths). The ill health and death attributable to all dietary risks for males was 2.2 times higher in the lowest socioeconomic areas compared with the highest socioeconomic areas (AIHW 2021b).
For more information on the disease burden due to dietary risks, see Burden of disease.
Fruit and vegetables
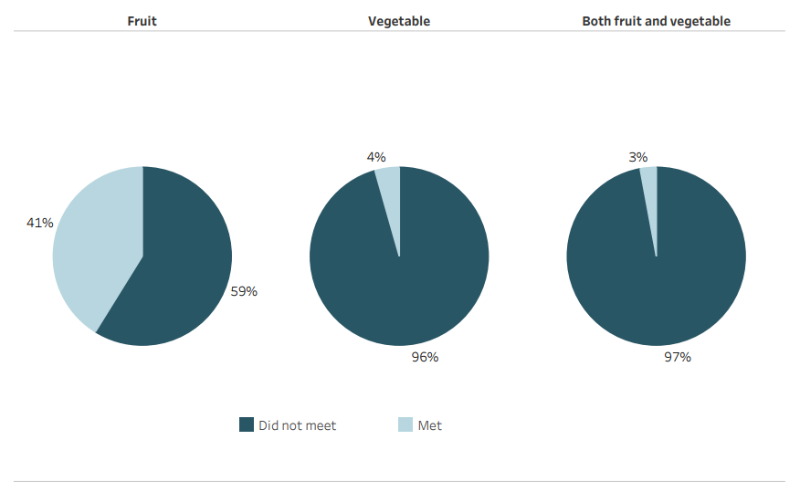
The 2013 Australian Dietary Guidelines recommend males consume a minimum of 2 serves of fruit and 5 to 6 serves of vegetables each day, depending on age, to ensure good nutrition and health.
Among males (Figure 17) (ABS 2022k):
- 41% of males meet the fruit intake guideline
- 4% meet the vegetable intake guideline
- only 3% meet the guideline for both fruit and vegetables.
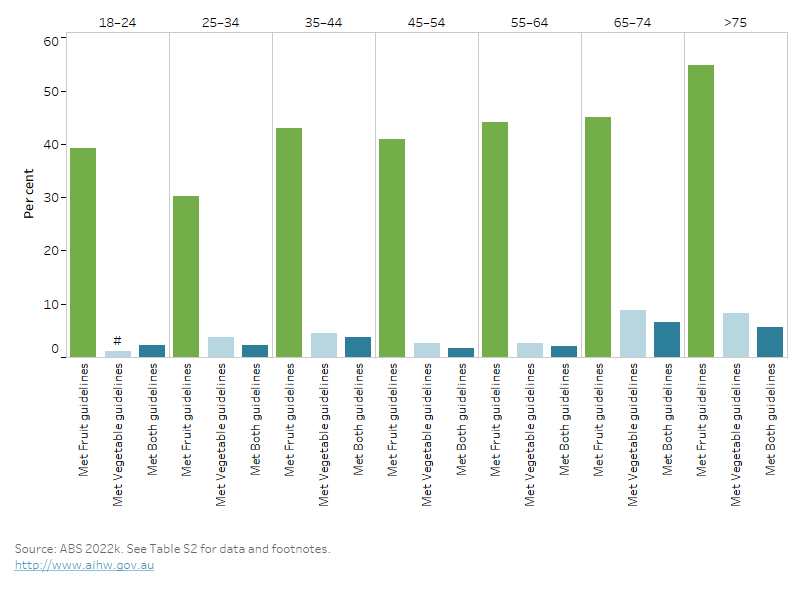
The proportion of males meeting the guideline varied by age (Figure 18) (ABS 2022k):
- 37% of males aged 18–44 met the guideline for fruit intake compared to 55% of those aged 75 and over.
- 8.3% of males aged 75 and over met the vegetable guideline compared to 3.7% of those aged 18–44.
Figure 17: Fruit and vegetable consumption against the Australian Dietary Guidelines (percentages), males, 2020–21
The bar chart shows the percentage of males who meet the 2013 fruit and vegetable intake guidelines across age groups. Males eat more fruit than vegetables in all age groups and this is highest in those aged 75 and over where 55% met the fruit intake guideline.
This horizontal bar chart shows the percentage males who consume sugar sweetened or selected diet drinks by usual consumption per week. It shows that 8.0% of males drink diet drinks daily and 8.5% drink sugar sweetened drinks daily.
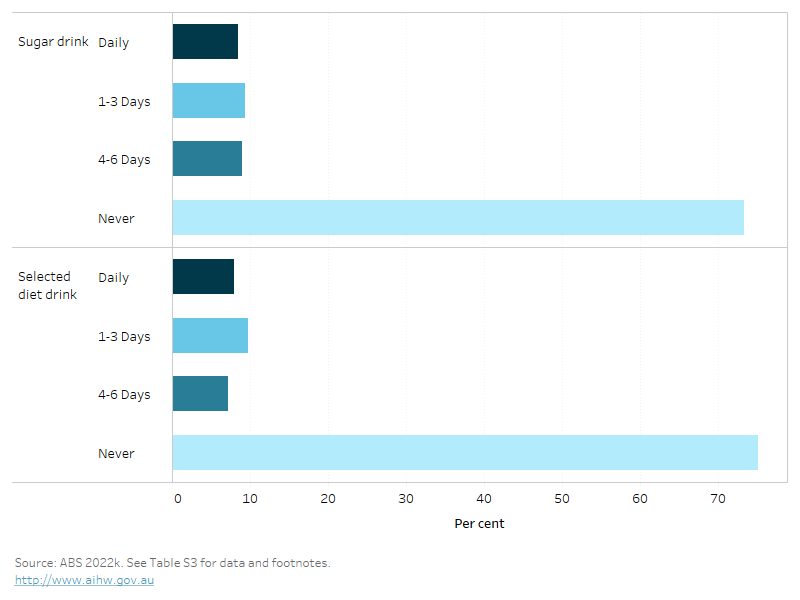
Notes:
- Sugar sweetened drinks includes soft drink, cordials, sports drinks or caffeinated energy drinks and may include soft drinks in ready to drink alcoholic beverages. Fruit juice, flavoured milk, ‘sugar free’ drinks or coffee/hot tea are excluded.
- Diet drinks includes drinks that have artificial sweeteners added to them rather than sugar. Includes diet soft drink, cordials, sports drinks or caffeinated energy drinks. May include diet soft drinks in ready to drink alcoholic beverages. Excludes non-diet drinks, fruit juice, flavoured milk, water or flavoured water or coffee/tea flavoured with sugar replacements.
The percentage of males who consume sugar sweetened daily varies by age group. More males aged 18–24 (11%) than males aged 65 and over (4.6%) drink sugar sweetened drinks daily.
Consumption also varied for some population groups. After adjusting for age, in 2017–18 (Figure 20) (ABS 2018b):
- males living in Outer regional and remote areas were almost twice as likely to drink sugar sweetened drinks daily compared with males in Major cities (18% compared with 11%)
- males living in the lowest socioeconomic areas were almost 3 times as likely to drink sugar sweetened drinks daily as males in the highest socioeconomic areas (17% and 6.1%, respectively).
Figure 20: Daily consumption of sugar sweetened drinks by socioeconomic and remoteness areas (percentage), males, 2017–18
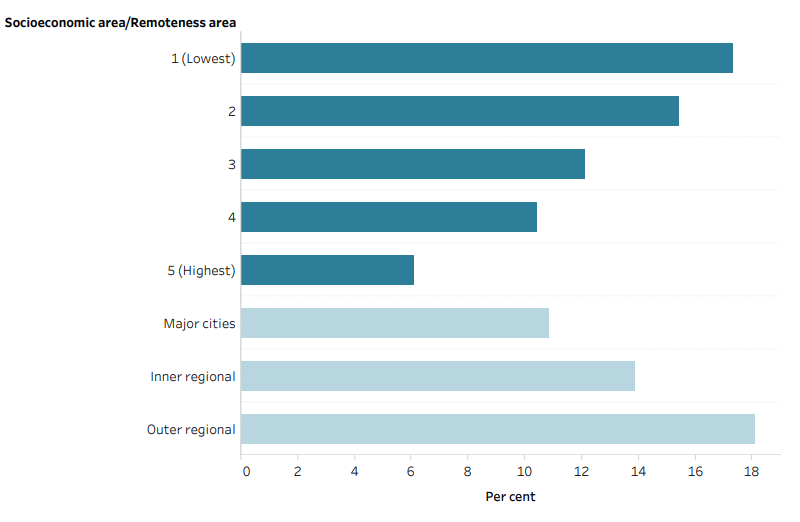
Note: Sugar sweetened drinks includes soft drink, cordials, sports drinks or caffeinated energy drinks and may include soft drinks in ready to drink alcoholic beverages. Fruit juice, flavoured milk, ‘sugar free’ drinks or coffee/hot tea are excluded.
Source: AIHW analysis of ABS 2018b. See Table S3 for data and footnotes.
For more information on diet as risk factor for poor health, see Diet.
Low levels of physical activity are a major risk factor for many chronic conditions. Being physically active improves mental and musculoskeletal health and reduces other risk factors such as overweight and obesity, high blood pressure and high blood cholesterol.
Physical inactivity was the 10th leading preventable cause of ill health and premature death in males, responsible for 2.4% of ill health and premature death in Australia in 2018 (AIHW 2021b). Physical inactivity is linked to type 2 diabetes, coronary heart disease, dementia and bowel cancer.
Physical inactivity contributed to 3,800 deaths among males (4.5% of all male deaths) (AIHW 2022e). The ill health and death attributable to physical inactivity among males was almost double in the lowest socioeconomic areas compared with the highest socioeconomic areas (AIHW 2021b).
For more information on the disease burden due to physical inactivity, see Burden of disease.
Australia’s Physical Activity and Sedentary Behaviour Guidelines
Australia’s Physical Activity and Sedentary Behaviour Guidelines outline the minimum amount of physical activity required for health benefits (DoHAC 2021). These recommend that adults aged 18–64:
- accumulate 150 to 300 minutes (2.5 to 5 hours) of moderate intensity physical activity or 75 to 150 minutes (1.25 to 2.5 hours) of vigorous intensity physical activity or an equivalent combination of both moderate and vigorous activities, each week
- do muscle-strengthening activities on at least 2 days each week.
For adults aged 65 and over, the Guidelines recommend at least 30 minutes of moderate intensity physical activity on most, preferably all, days. The data presented in this section are for adults only. For information on physical activity for children and young people see Physical activity across the life stages report.
‘Sufficiently physically active’ refers to meeting the physical activity component of the Guidelines and is defined in this report as:
- completing 150 minutes or more of moderate to vigorous physical activity per week (where vigorous activity is multiplied by 2), and
- being active on 5 or more days per week.
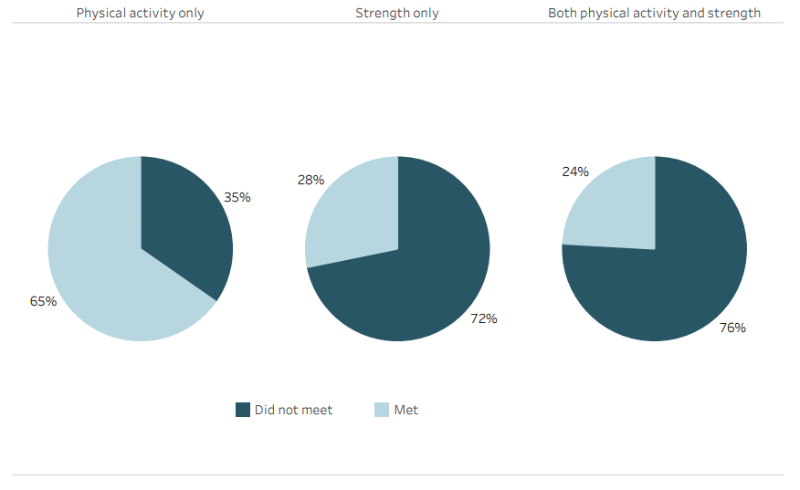
Among males, 65% of males do sufficient moderate and vigorous physical activity per week, and only 28% do strength or toning activities on 2 more days per week, in 2020–21 (ABS 2022g).
Overall, only 24% of males meet the guidelines for physical activity and strength (Figure 21) (ABS 2022g).
The proportion of males who were sufficiently physically active varies by age and for some population groups:
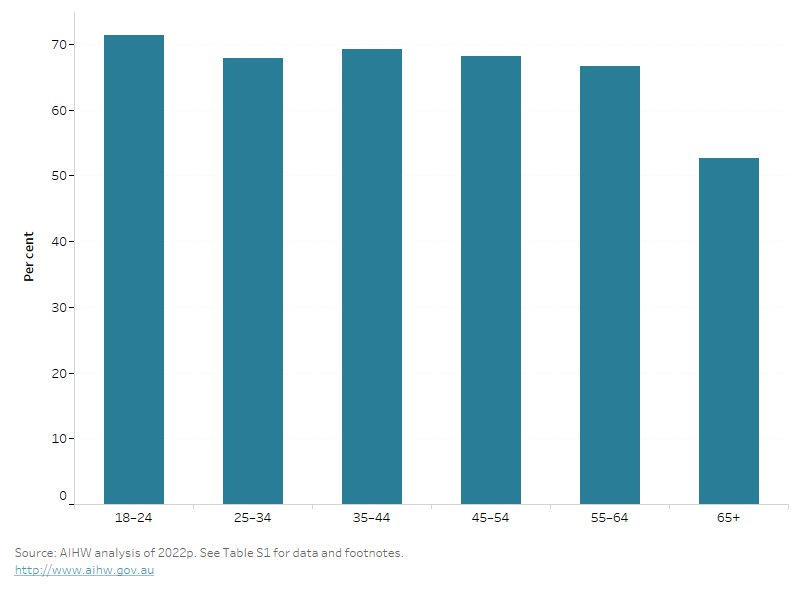
- 71% of males aged 18–24 are sufficiently physically active compared with 53% aged 65 and over (Figure 22).
- After adjusting for age, 56% living in the highest socioeconomic areas were sufficiently physically active, compared with around 42% living in the lowest socioeconomic areas (ABS 2018b).
For more information, see Physical activity.
Figure 21: Physical activity guidelines compliance (percentage), males, 2020–21
The bar chart shows the percentage of males who are sufficiently active across various age groups. Physical activity generally decreases with age, with the most sufficiently physically active in 18–24 years (71.3%).