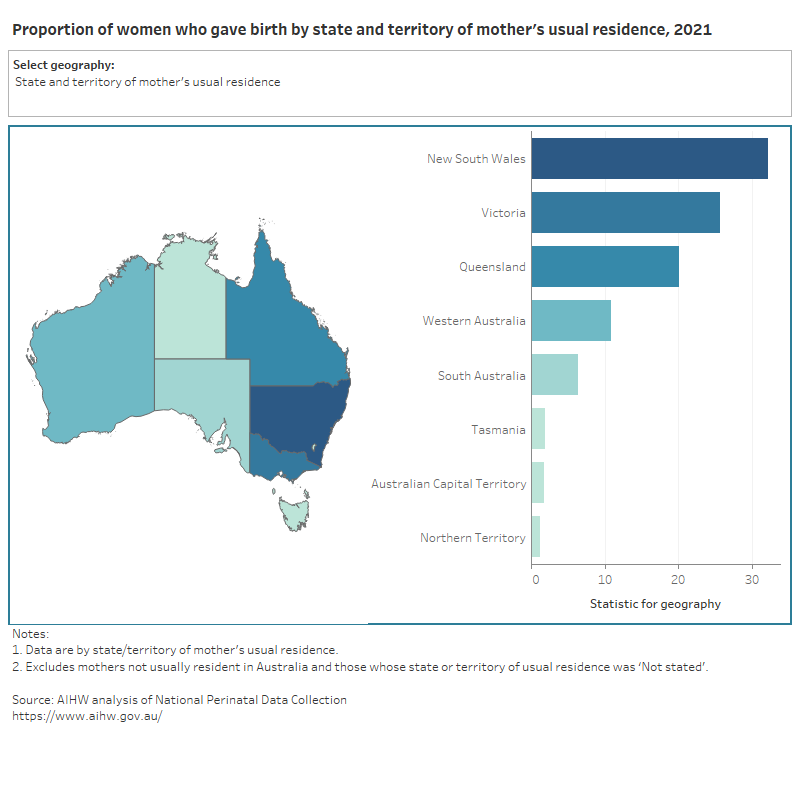
Geography
Map of proportion of women who gave birth across Australia grouped by various geographies.
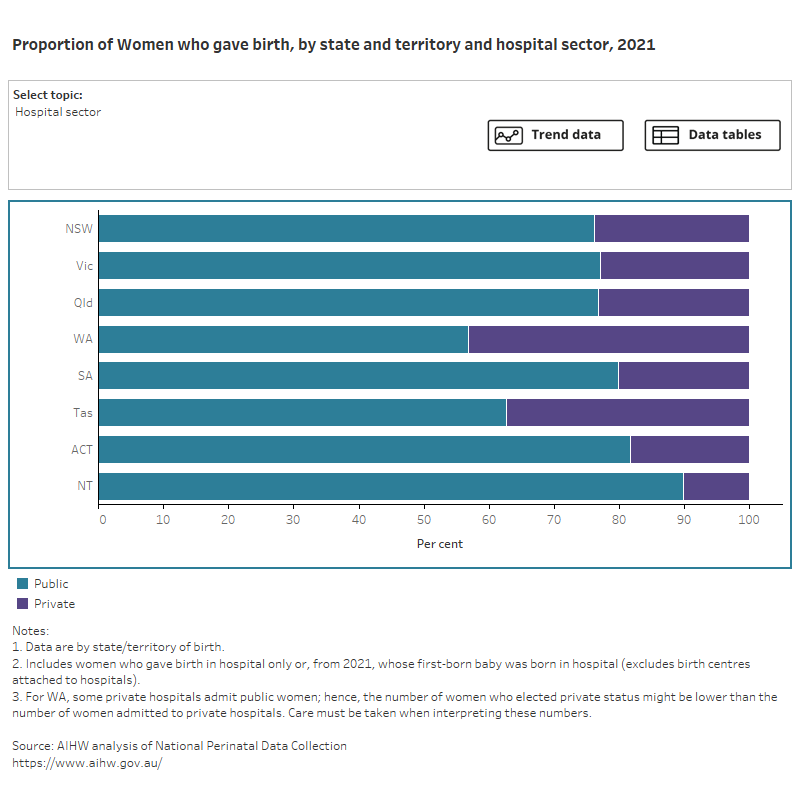
Bar chart shows state or territory of residence or birth by selected topics and a line graph shows topic trends between 2011 and 2021.
Australian Institute of Health and Welfare (2023) Australia's mothers and babies, AIHW, Australian Government, accessed 24 April 2024.
Australian Institute of Health and Welfare. (2023). Australia's mothers and babies. Retrieved from https://pp.aihw.gov.au/reports/mothers-babies/australias-mothers-babies
Australia's mothers and babies. Australian Institute of Health and Welfare, 13 December 2023, https://pp.aihw.gov.au/reports/mothers-babies/australias-mothers-babies
Australian Institute of Health and Welfare. Australia's mothers and babies [Internet]. Canberra: Australian Institute of Health and Welfare, 2023 [cited 2024 Apr. 24]. Available from: https://pp.aihw.gov.au/reports/mothers-babies/australias-mothers-babies
Australian Institute of Health and Welfare (AIHW) 2023, Australia's mothers and babies, viewed 24 April 2024, https://pp.aihw.gov.au/reports/mothers-babies/australias-mothers-babies
PDF | 11.8Mb
Map of proportion of women who gave birth across Australia grouped by various geographies.
Bar chart shows state or territory of residence or birth by selected topics and a line graph shows topic trends between 2011 and 2021.