Stillbirths and neonatal deaths

Content warning: This content contains information some readers may find distressing as it relates to stillbirth and the loss of a baby.


In 2021, in Australia, 3,016 babies died in the perinatal period. Three-quarters (2,278) were stillbirths and the remaining 738 were neonatal deaths. This article provides information related to these deaths, including causes, maternal characteristics, timing and investigations.

The data presented in this article are from the National Perinatal Mortality Data Collection. It follows publication of preliminary data on perinatal deaths from the National Perinatal Data Collection, available in the Preliminary perinatal deaths section of this web report.

Overview of perinatal deaths

Australia is one of the safest places in the world for a baby to be born, yet death occurring within the perinatal period (from 20 weeks of gestation to 28 days after birth) is not uncommon. On an average day in Australia, 6 babies are stillborn and 2 die within 28 days of birth (neonatal death).

In 2021, there were:

  • 315,705 babies born to 311,360 women
  • 3,016 perinatal deaths (1% of babies born). Of these deaths, just over three-quarters (76%) were stillbirths (2,278) and 24% (738) were neonatal deaths (Figure 1)
  • 9.6 perinatal deaths per 1,000 births (7.2 stillbirths per 1,000 births and 2.4 neonatal deaths per 1,000 live births).

Figure 1: Overview of perinatal deaths in 2021

Summary breakdown of the 3,016 perinatal deaths in 2021, by type (stillbirth vs neonatal death) and timing. Congenital anomaly was the most common cause.

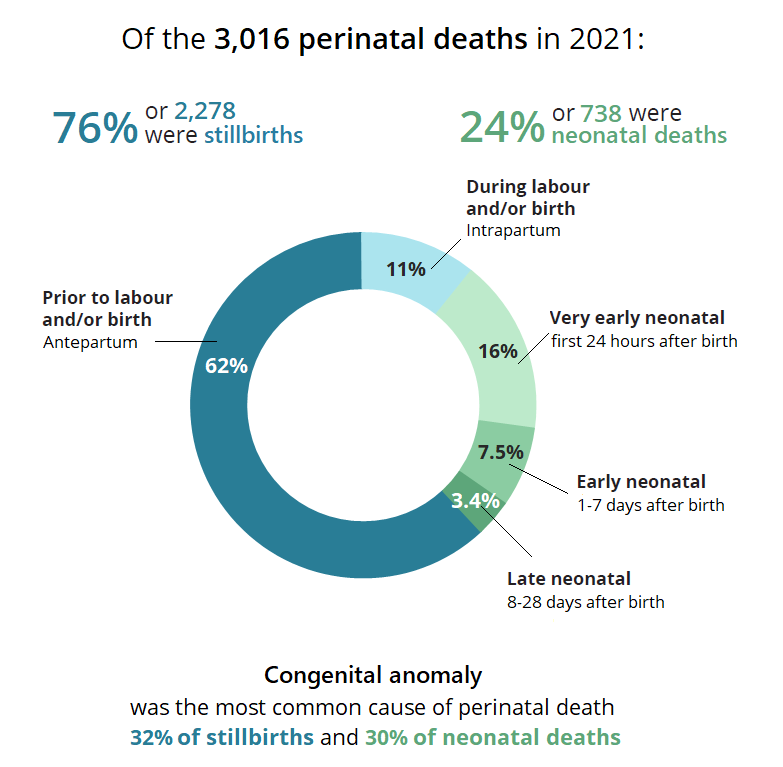
Note: Proportions for the timing of perinatal deaths (shown in the donut chart) do not add to the totals shown at the top of the figure, as they were calculated after excluding perinatal deaths where timing is not stated or unknown.

Chart: AIHW. Source: AIHW analysis of the National Perinatal Mortality Data Collection.

How have perinatal mortality rates changed over time?

Trends in this report cover a 20-year period from 2002 to 2021. However, data for 2002 are missing from some states and territories and hence 2003 is used as a baseline for comparison.

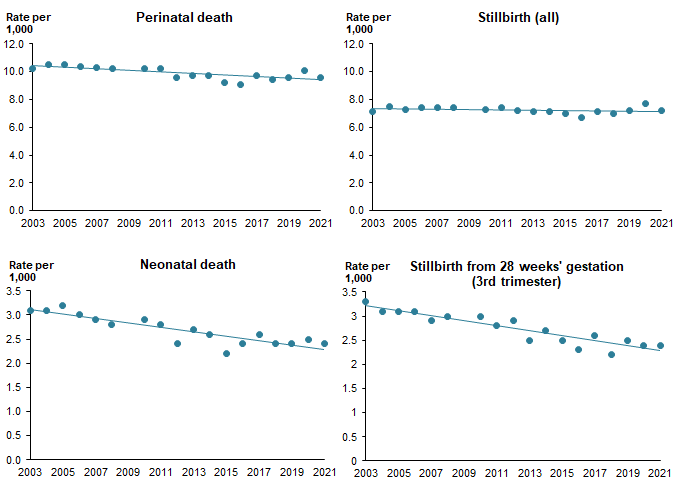
Between 2003 and 2021 the rate of perinatal death has varied between 9.1 and 10.5 deaths per 1,000 births, with a slight decrease from 2003 (Figure 2). The rate has decreased over this period for two categories in particular:

  • stillbirths occurring at 28 weeks’ gestation or more
  • neonatal deaths of babies born at 23 weeks’ gestation or more.

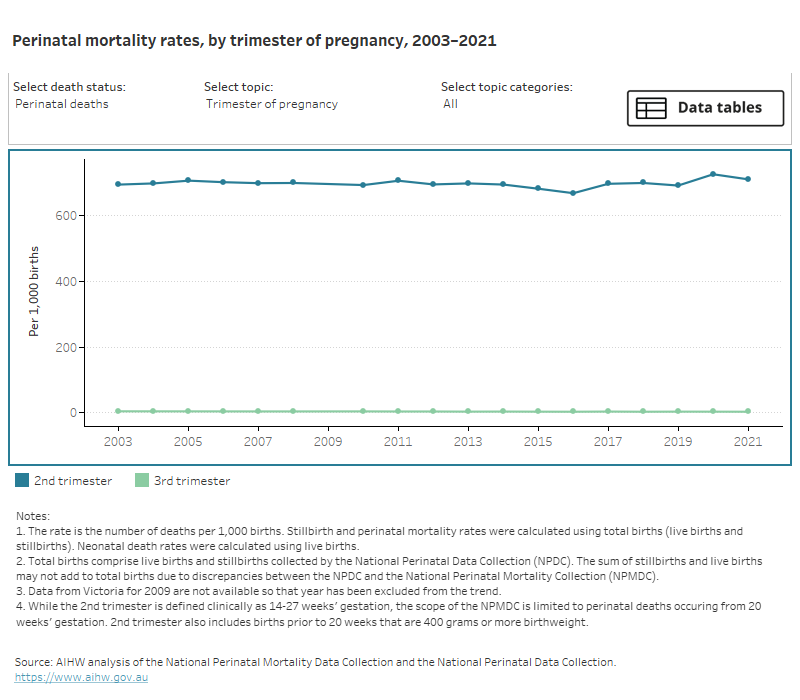
The overall stillbirth rate has remained between 6.7 and 7.7 per 1,000 births between 2003 and 2021. The rate in 2021 (7.2 per 1,000 births) is lower than in 2020 (7.7) – which marked a 20-year high-point – and the same as in 2019. The high rate in 2020 coincided with events such as the severe bushfires and the first year of the COVID-19 pandemic in Australia. These changes are similar to year-to-year fluctuations observed in the stillbirth rate since 2003. The rate of stillbirths occurring from 28 weeks’ gestation (third trimester) has continued to decline.

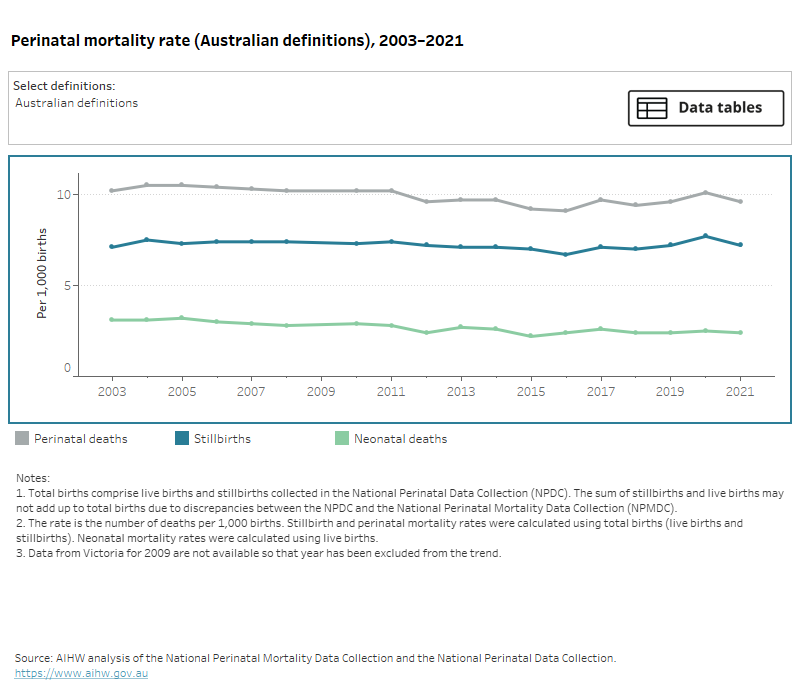
Figure 2: Perinatal mortality rates in Australia 2003–2021

Rates of neonatal death, stillbirth, stillbirth in third trimester, and overall perinatal mortality over the period from 2003 to 2021.

Notes:

  1. The rate is the number of deaths per 1,000 births. Stillbirth and perinatal death rates were calculated using total births (live births and stillbirths). Neonatal death rates were calculated using live births.
  2. Data for 2002 and 2009 were excluded from the model as data are missing from some states and territories for these years.
  3. The stillbirth rate reported for stillbirths from 28 weeks’ gestation is similar to the rate reported using the WHO definition for international comparison. For more information see Perinatal mortality rates for international comparison.

Chart: AIHW. Source: AIHW analysis of the National Perinatal Mortality Data Collection and the National Perinatal Data Collection

For data on perinatal mortality rates over time see tables 1 and 5 of the supplementary data tables (Data tables: National Perinatal Mortality Data Collection annual update 2021).

Perinatal mortality rates for international comparison

Definitions of perinatal mortality

Perinatal mortality rates in Australia are reported here using 2 distinct definitions for stillbirth.

The first (termed the Australian definition) defines stillbirth as a fetal death prior to birth of a baby born at 20 weeks’ gestation or more, and/or weighing 400 grams or more. This is the standard definition used for stillbirths in Australia.

A second definition for stillbirth is that used by the World Health Organisation (WHO), where stillbirths are defined as those occurring in the third trimester – born at 28 weeks’ gestation or more, and/or weighing 1,000 grams or more (WHO 2018). This definition is used for the purposes of international reporting and comparison.

Reporting of neonatal deaths is the same for both the Australian and WHO definitions. Neonatal deaths are all registered deaths occurring within 28 days of birth (WHO 2018). In Australia, registered deaths are those born at 20 weeks’ gestation or more, and/or weighing 400 grams or more.

Using the WHO definition of stillbirth excludes the smaller and less mature babies who are included when the standard definition applied in Australia is used. Australian perinatal mortality rates reported using the WHO definitions are therefore lower than those reported using the Australian definitions.

Refer to the Technical notes – Definitions for more information on WHO definitions of perinatal mortality.

The rate of stillbirths in Australia, using the WHO definition (stillbirth born at 28 weeks’ gestation or more, or 1,000 grams birthweight or more), has decreased from 3.3 per 1,000 births in 2003 to 2.5 per 1,000 births in 2021.

By comparison, using the Australian definition the rate of stillbirths has not followed a single trend over this period, ranging between 6.7 and 7.7 per 1,000 births.

The rate of neonatal deaths in Australia decreased from 3.1 per 1,000 live births in 2003 to 2.4 per 1,000 live births in 2021. The rate of neonatal deaths in Australia is the same using both the Australian and WHO definitions.

Data on perinatal mortality rates over time using the Australian and WHO definitions can be explored in the interactive data visualisation below (Figure 3), with data also presented in tables 1 and 2 of the supplementary data tables (Data tables: National Perinatal Mortality Data Collection annual update 2021).

Figure 3: Perinatal mortality rates in Australia, by selected definition, 2003–2021

Rates of stillbirth, neonatal death, and overall perinatal death between 2003 and 2021, using either the Australian or WHO definitions.

Comparability with data from the Australian Bureau of Statistics

Perinatal death data reported by the Australian Bureau of Statistics (ABS) are not directly comparable with data from the National Perinatal Mortality Data Collection (NPMDC) and the National Perinatal Data Collection (NPDC).

ABS data are sourced from state and territory registrars of Births, Deaths and Marriages. NPMDC and NPDC data are sourced from midwives and other staff, who collect information from mothers and perinatal administrative and clinical record systems.

For more information on comparing data from the NPMDC against ABS registrations of death data, please refer to the Technical notes – Data quality and availability.

Maternal characteristics

This section presents data on maternal and medical characteristics, as supplied to the NPDC, which have been commonly associated with stillbirth or neonatal death.

While these characteristics are more commonly found in women with pregnancies resulting in stillbirth and neonatal death, they are characteristics that are numerically associated with perinatal death and it is not implied that they are the cause of perinatal deaths.

Key demographics

Perinatal mortality rates were higher among babies born to:

  • women who were aged under 20 or 40 and over (21 and 14 deaths per 1,000 births, respectively)
  • First Nations women (17 deaths per 1,000 births)
  • women who lived in Very remote areas (19 deaths per 1,000 births)
  • women living in the most disadvantaged areas of Australia (12 deaths per 1,000 births for quintile 1)
  • women who smoked throughout pregnancy (16 deaths per 1,000 births)
  • women who have had several previous pregnancies (17 deaths per 1,000 births among women who had a parity of 4 or more).

Data on perinatal mortality rates by selected maternal characteristics can be explored in the interactive data visualisation below (Figure 4), with data also presented in Table 3 of the supplementary data tables (Data tables: National Perinatal Mortality Data Collection annual update 2021).

Figure 4: Stillbirth and neonatal mortality rates, by selected maternal characteristic, 2021

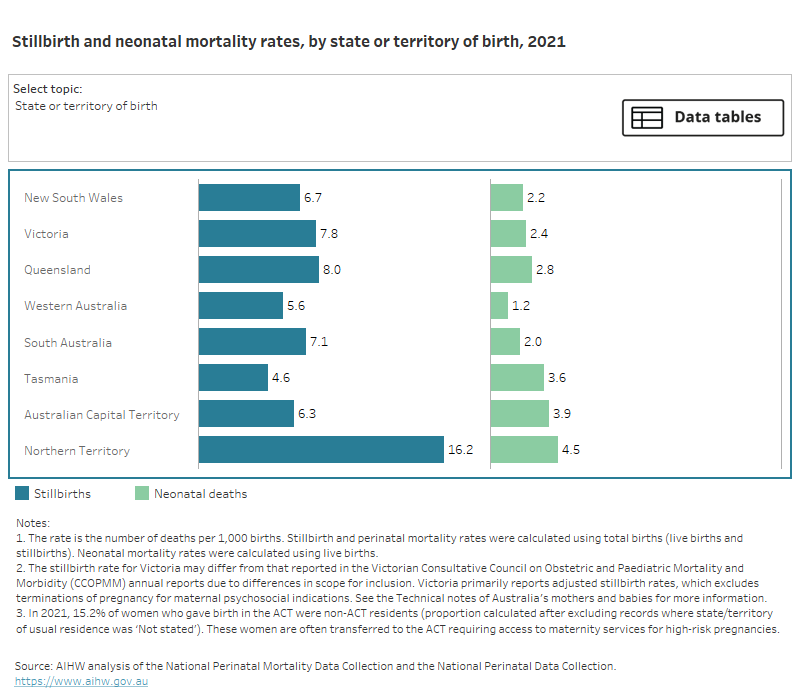
Rates of stillbirth and neonatal death in 2021 by various maternal demographic characteristics, including state/territory of birth.

Country of birth

There was little overall difference in perinatal mortality rates for babies of women born in Australia (9.4 perinatal deaths per 1,000 births) compared with babies of women born overseas (9.3 perinatal deaths per 1,000 births). The highest rates of perinatal death were among babies of women whose country of birth was in:

  • Melanesia (23 perinatal deaths per 1,000 births)
  • Central and West Africa (17 perinatal deaths per 1,000 births)
  • North Africa (16 perinatal deaths per 1,000 births).

For detailed data on perinatal mortality rates by mother’s country of birth, see Table 3 of the supplementary data tables (Data tables: National Perinatal Mortality Data Collection annual update 2021).

Baby characteristics

Gestational age and birthweight

Birthweight and gestational age are interrelated and birthweight is generally expressed in relation to gestational age using population percentiles.

Refer to the Technical notes – Methods for more information on birthweight percentiles used in this report.

A baby may be small due to being pre-term (born early), or due to being small for gestational age (either because it is small due to genetic factors, or because it is the subject of a growth restriction within the uterus). Poor fetal growth is associated with increased risk of perinatal death and with fetal distress during labour, and these babies are more likely to develop long-term health conditions later in life.

Expressing birthweight in relation to gestational age allows for differences in a baby's growth status and maturity to be taken into account when examining their health outcomes at birth.

Babies are defined as being small for gestational age if their birthweight is below the 10th percentile for their gestational age and sex, as determined by national percentiles. Babies are defined as large for gestational age if their birthweight is above the 90th percentile for their gestational age and sex.

In 2021:

  • 2 in 5 perinatal deaths (40%) occurred among babies born before 23 completed weeks’ gestation
  • rates of perinatal death decreased rapidly with increasing gestational age and were lowest among babies born at or near term (from 36 weeks’ gestation).

The highest rates of perinatal death in 2021 were among:

  • babies born at less than 23 weeks’ gestation (just over 980 deaths per 1,000 births)
  • babies born with a birthweight less than 2,500 grams (just over 110 deaths per 1,000 births)
  • babies who were small for gestational age (25 deaths per 1,000 births)
  • multiple births (35 and 80 deaths per 1,000 births, for twin and triplet or higher plurality respectively).

Detailed data on perinatal mortality rates by birthweight and gestational age can be explored in the interactive data visualisation below (Figure 5), with data also presented in Table 4 of the supplementary data tables (Data tables: National Perinatal Mortality Data Collection annual update 2021).

Figure 5: Stillbirth and neonatal mortality rates, by selected baby characteristic, 2021

Rates of stillbirth and neonatal death in 2021 by characteristics of the baby and pregnancy, including birthweight, gestation, and plurality.

Gestational age trend

In the period since 2003 perinatal mortality rates have been gradually decreasing among babies born at or after 28 weeks’ gestation.

Stillbirths occurring from 28 weeks’ gestation, or in the third trimester of pregnancy, are known as late gestation stillbirths. Evidence indicates that these stillbirths are the ones most likely to be preventable (Flenady et al. 2016). The rate of late gestation stillbirths in Australia has decreased from 3.3 per 1,000 births in 2003 to 2.4 per 1,000 births in 2021.

Rates of stillbirth among babies born before 28 weeks’ gestation (second trimester) have, in contrast, increased over this period, rising from just over 460 deaths per 1,000 births in 2003 to almost 540 deaths per 1,000 births in 2021.

Neonatal deaths in both the second and third trimesters of pregnancy have decreased over this period, with deaths in the third trimester (28 weeks’ gestation or more) decreasing from 1.1 per 1,000 births in 2003 to 0.8 per 1,000 births in 2021.

Detailed data on trends in perinatal mortality rates by gestational age can be explored in the interactive data visualisation below (Figure 6), with data also presented in Table 5 of the supplementary data tables (Data tables: National Perinatal Mortality Data Collection annual update 2021).

Figure 6: Perinatal mortality rates, by selected gestational age grouping, 2003–2021

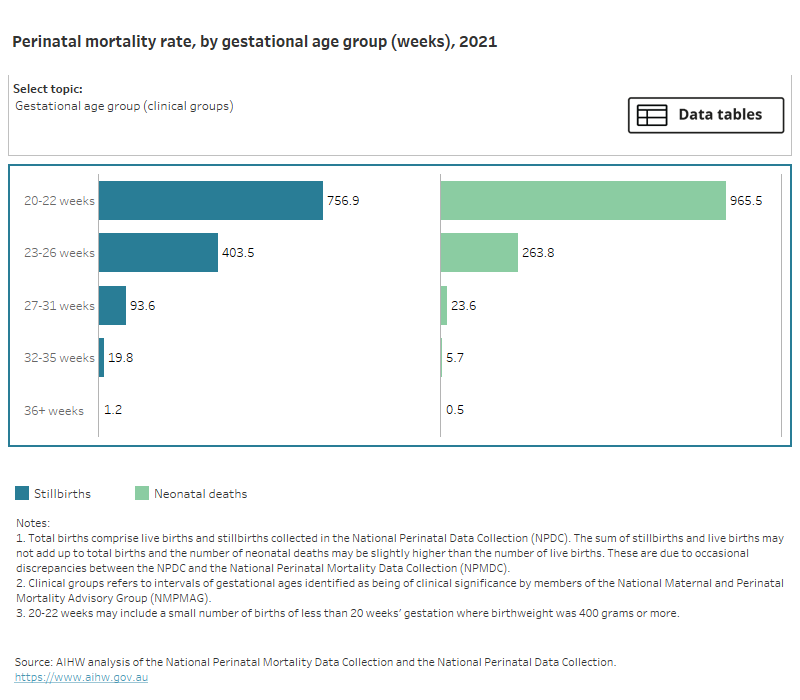
Rates of stillbirth, neonatal death, or overall perinatal death between 2003 and 2021, by gestational age.

Timing, causes and investigation of perinatal deaths

Timing of perinatal deaths

Intrapartum stillbirth (fetal death occurring during labour and birth) and neonatal death within the first 24 hours after birth are often considered together as, in many cases, the process leading to the death is a continuum that may result in death before or after the birth occurs.

In 2021, where the timing of perinatal deaths was stated:

  • The majority of stillbirths (85%) occurred before the onset of labour (antepartum). This accounted for 3 in 5 (62%) of all perinatal deaths.
  • Over a quarter (27%) of perinatal deaths occurred during labour and/or birth (intrapartum death) or within the first 24 hours following birth (very early neonatal death).
  • Three in 5 (60%) neonatal deaths occurred within the first 24 hours following birth (very early neonatal death) and were more common with earlier gestational age.
  • Early neonatal deaths (1–7 days following birth) were more common among babies born 23–26 weeks (38%) and from 36 weeks’ gestation (30%).
  • Late neonatal deaths (8–28 days following birth) were more common among babies born from 36 weeks’ gestation (42%).

Percentages are calculated after excluding records with ‘not stated’ values (331, or 11% of records). Care must therefore be taken when interpreting percentages.

Detailed data on the timing of perinatal deaths in 2021 can be explored in the interactive data visualisation below (Figure 7), with data also presented in Table 6 of the supplementary data tables (Data tables: National Perinatal Mortality Data Collection annual update 2021).

Figure 7: Proportion of perinatal deaths, by timing of death, 2021

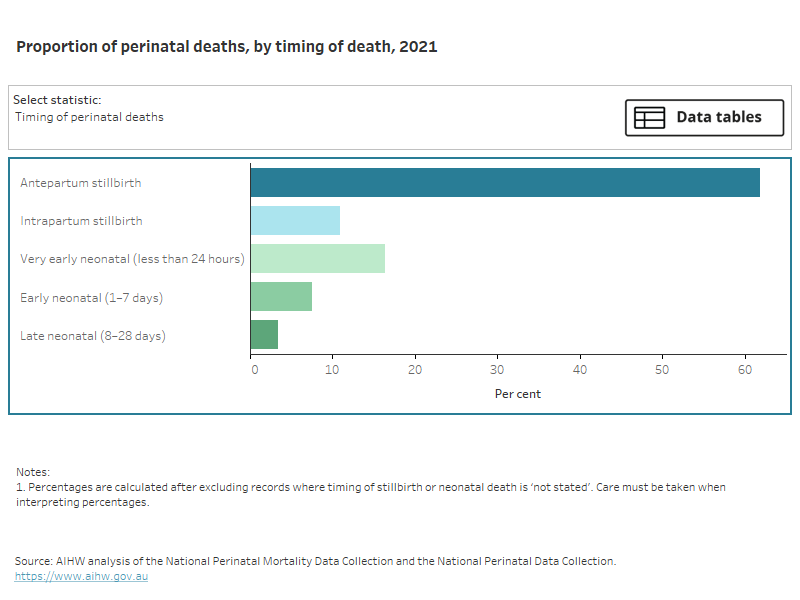
Timing of perinatal death as a proportion of all perinatal deaths in 2021. In a separate view, these data are broken down by gestational age group.

Causes of perinatal death

Classifying cause of death

Causes of perinatal deaths are classified according to the Perinatal Society of Australia and New Zealand (PSANZ) Perinatal Mortality Classification System, version 4.3, as part of each state or territory’s perinatal mortality review process.

The PSANZ Perinatal Mortality Classification System incorporates a Perinatal Death Classification (PSANZ-PDC), which includes maternal/fetal causes and is applied to all perinatal deaths (stillbirths and neonatal deaths), and a Neonatal Death Classification (PSANZ-NDC), which includes neonatal causes and is additionally applied to neonatal deaths only.

Refer to Technical notes – Definitions for more information on cause of death classifications.

Maternal and fetal causes of perinatal death (PSANZ-PDC)

PSANZ-PDC classification

The PSANZ-PDC system classifies all perinatal deaths (stillbirths and neonatal deaths) by the single most important maternal/fetal factor which led to the chain of events that resulted in the death.

Refer to Technical notes – Definitions for more information on cause of death classifications.

In 2021:

  • the most commonly classified causes for all perinatal deaths were:
    • congenital anomaly (31%)
    • spontaneous preterm labour or rupture of membranes (<37 weeks’ gestation) (15%)
    • unexplained antepartum fetal death (11%)
  • the most commonly classified causes of stillbirths were:
    • congenital anomaly (32%)
    • unexplained antepartum fetal death (15%)
    • maternal conditions (13%)
  • the most commonly classified causes of neonatal deaths were:
    • spontaneous preterm labour or rupture of membranes (<37 weeks’ gestation) (35%)
    • congenital anomaly (30%)
    • antepartum haemorrhage (6.9%).

Detailed data on the causes of perinatal deaths in 2021 can be explored in the interactive data visualisation below (Figure 8), with data also presented in Table 7 of the supplementary data tables (Data tables: National Perinatal Mortality Data Collection annual update 2021).

Figure 8: Number of perinatal deaths, by PSANZ-PDC and selected characteristic, 2021

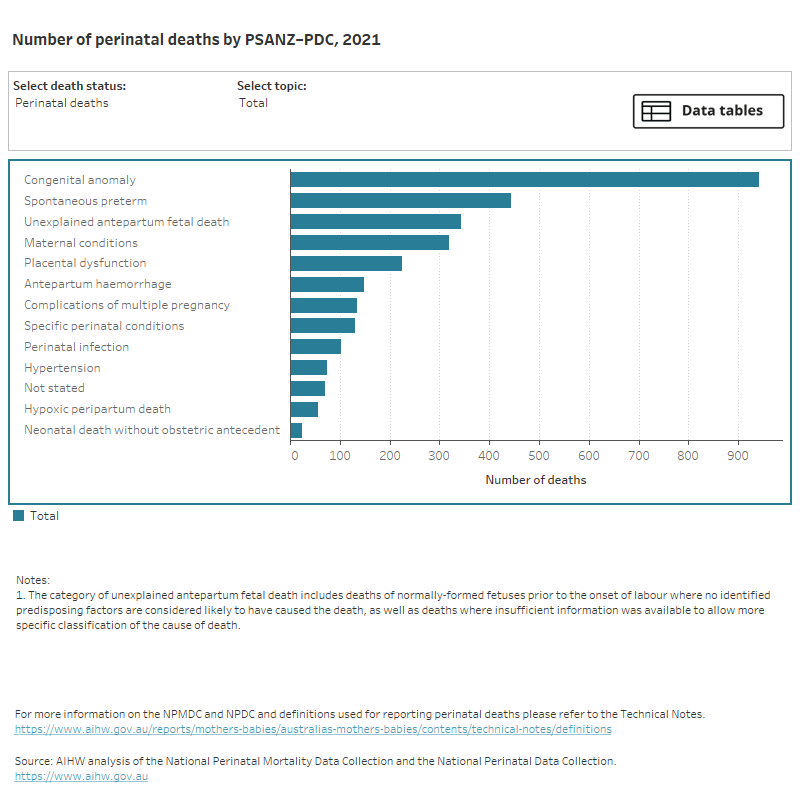
Causes of perinatal deaths in 2021. In separate views, these data are broken down by various characteristics including gestation, birthweight percentile.

In 2021, congenital anomaly was the most commonly classified cause of stillbirth (32% of stillbirths). This remained true across almost all groups of perinatal deaths, regardless of maternal or gestational age, plurality, baby’s birthweight percentile or the timing of death.

Some exceptions to this were for:

  • Near or at term stillbirths. Unexplained antepartum fetal death was the most commonly classified cause of death for stillbirths occurring from 36+ weeks’ gestation (28%), followed by placental dysfunction or causative placental pathology (17%).
  • Babies born to mothers aged under 20 or aged 20–24. Maternal conditions were the most commonly classified cause of stillbirths for babies born to mothers aged under 20 and aged 20–24 (47% and 28%, respectively). Maternal conditions refers to deaths where a medical condition (for example, diabetes) or a surgical condition (for example, appendicitis) or an injury in the mother (including complications or treatment of that condition) is the cause.
  • Multiple births. Complications of multiple pregnancy (including twin-to-twin transfusion syndrome and umbilical cords becoming entangled where the babies are in only one amniotic sac) was the most commonly classified cause for multiples (58% of stillbirths).

In 2021, spontaneous preterm labour or rupture of membranes (<37 weeks’ gestation) was the most commonly classified cause of neonatal deaths (35%). This was true for a number of groups of neonatal deaths, with the exception of the following groups, where it was usually the second most commonly classified cause of death:

  • Neonatal deaths in babies considered small for gestational age. Congenital anomaly was the main classified cause of neonatal deaths for babies considered small birthweight for their gestational age (47%).
  • Neonatal deaths in babies born at 36 weeks’ gestation or more. Congenital anomaly was the most commonly classified cause for neonatal deaths occurring at 36+ weeks’ (47%) gestation. This was followed by hypoxic peripartum death (20%).
  • Neonatal deaths in babies born to mothers aged 30–34. Congenital anomaly was the most commonly classified cause for neonatal deaths for babies born to mothers aged 30–34 (36%).
  • Singleton births. Congenital anomaly was the most commonly classified cause of neonatal death for singletons (33%).

Causes of death in the neonatal period (PSANZ-NDC)

PSANZ-NDC classification

The PSANZ-NDC is an additional classification system, applied only to neonatal deaths, to identify the single most significant condition present in the neonatal period that caused the baby’s death.

Refer to Technical notes – Definitions for more information on cause of death classifications.

In 2021, the most commonly classified conditions causing neonatal deaths were:

  • periviable infants (infants deemed too immature for resuscitation or continued life support, typically less than 24 weeks’ gestation; 38%)
  • congenital anomaly (27%)
  • neurological conditions (14%).

Data on the causes of neonatal deaths in 2021 can be explored in the interactive data visualisation below (Figure 9), with data also presented in Table 8 of the supplementary data tables (Data tables: National Perinatal Mortality Data Collection annual update 2021).

Figure 9: Number of neonatal deaths, by PSANZ-NDC, 2021

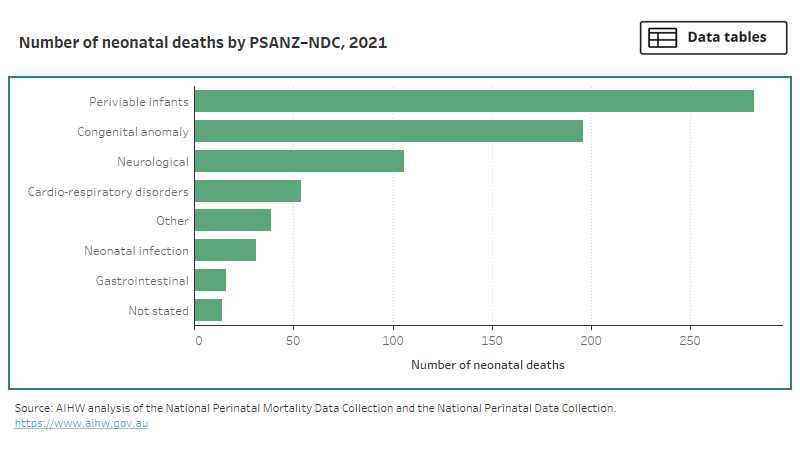
Causes of neonatal deaths in 2021. Periviable infants (typically <24 weeks’ gestation) was the most commonly classified condition.

Investigation following perinatal death

Autopsy

The National Perinatal Mortality Data Collection includes data on whether an autopsy was performed and, where applicable, the type of autopsy performed (a full autopsy, limited autopsy or external examination). For the purposes of this report, deaths where any of these autopsy types have been performed are collectively treated as deaths where an ‘autopsy’ has been performed.

The purpose of an autopsy is to accurately identify the cause(s) of death. Autopsy results contribute to clinical audit and assist with identification of factors contributing to the death, and may be critical when clinicians consider providing parents with advice regarding the risk of a future perinatal death (RCOG 2010). Perinatal autopsy examinations require written consent from the parent(s) following informed discussion.

Whether an autopsy was performed was reported for 95% of the 3,016 perinatal deaths in 2021.

Of deaths where autopsy status was known, an autopsy was performed for:

  • 1,163 (41%) perinatal deaths
  • 935 (43%) stillbirths, and
  • 228 (33%) neonatal deaths.

Percentages are calculated after excluding records with ‘not stated’ values (145, or 5% of records). Care must therefore be taken when interpreting percentages.

Data on autopsies for perinatal deaths in 2021 can be explored in the interactive data visualisation below (Figure 10), with data also presented in Table 9 of the supplementary data tables (Data tables: National Perinatal Mortality Data Collection annual update 2021).

Figure 10: Proportion of autopsy performed for perinatal deaths, 2021

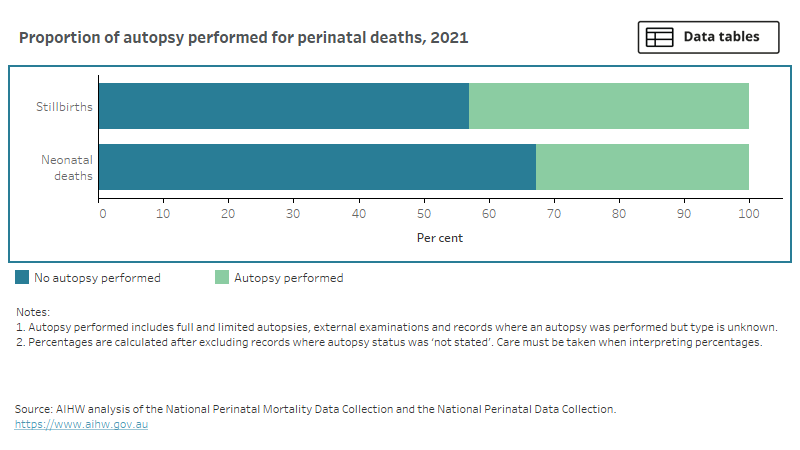
Proportions of stillbirths and neonatal deaths in 2021 for which an autopsy was performed. In the majority of cases autopsies were not performed.