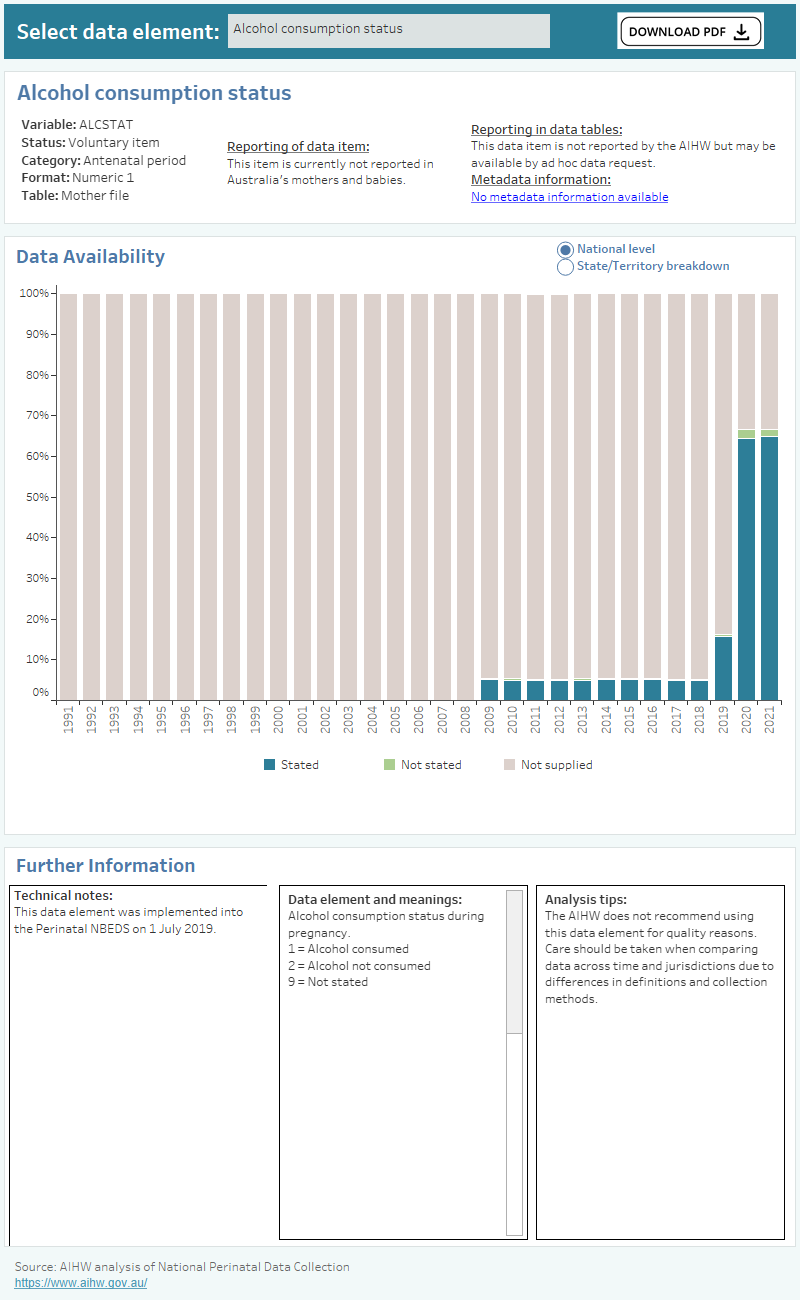
National Perinatal Data Collection data availability resource
Citation
AIHW
Australian Institute of Health and Welfare (2023) National Perinatal Data Collection data availability resource, AIHW, Australian Government, accessed 24 April 2024.
APA
Australian Institute of Health and Welfare. (2023). National Perinatal Data Collection data availability resource. Retrieved from https://pp.aihw.gov.au/reports/mothers-babies/national-perinatal-data-collection-data-resource
MLA
National Perinatal Data Collection data availability resource. Australian Institute of Health and Welfare, 11 October 2023, https://pp.aihw.gov.au/reports/mothers-babies/national-perinatal-data-collection-data-resource
Vancouver
Australian Institute of Health and Welfare. National Perinatal Data Collection data availability resource [Internet]. Canberra: Australian Institute of Health and Welfare, 2023 [cited 2024 Apr. 24]. Available from: https://pp.aihw.gov.au/reports/mothers-babies/national-perinatal-data-collection-data-resource
Harvard
Australian Institute of Health and Welfare (AIHW) 2023, National Perinatal Data Collection data availability resource, viewed 24 April 2024, https://pp.aihw.gov.au/reports/mothers-babies/national-perinatal-data-collection-data-resource


