Baby measurements
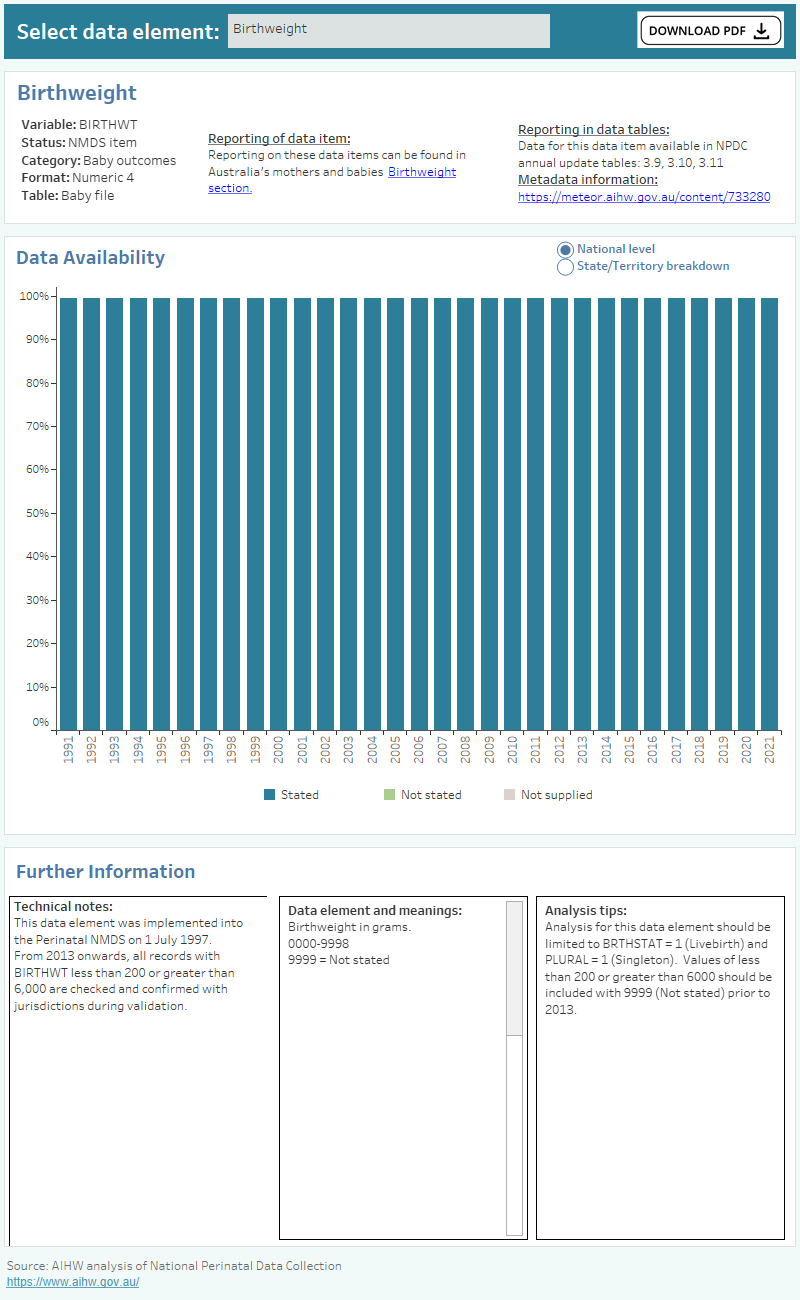
Bar chart shows total percentage of baby measurements data supplied by states and territories between 1991 and 2021.
Australian Institute of Health and Welfare (2023) National Perinatal Data Collection data availability resource, AIHW, Australian Government, accessed 20 April 2024.
Australian Institute of Health and Welfare. (2023). National Perinatal Data Collection data availability resource. Retrieved from https://pp.aihw.gov.au/reports/mothers-babies/national-perinatal-data-collection-data-resource
National Perinatal Data Collection data availability resource. Australian Institute of Health and Welfare, 11 October 2023, https://pp.aihw.gov.au/reports/mothers-babies/national-perinatal-data-collection-data-resource
Australian Institute of Health and Welfare. National Perinatal Data Collection data availability resource [Internet]. Canberra: Australian Institute of Health and Welfare, 2023 [cited 2024 Apr. 20]. Available from: https://pp.aihw.gov.au/reports/mothers-babies/national-perinatal-data-collection-data-resource
Australian Institute of Health and Welfare (AIHW) 2023, National Perinatal Data Collection data availability resource, viewed 20 April 2024, https://pp.aihw.gov.au/reports/mothers-babies/national-perinatal-data-collection-data-resource
Bar chart shows total percentage of baby measurements data supplied by states and territories between 1991 and 2021.