GP attendances
A growing number of Australians saw a GP
In 2018–19, 88% of Australians, or 21.9 million people, visited a GP. Between 2013–14 and 2018–19, there was a relative increase in the percentage of the population using GP services (1.6%), in the number of services per 100 people (9.2%), and in the Medicare benefits paid for GP services (18%) (Table 1).
|
Measure |
2013–14 |
2018–19 |
Relative % change in rate since |
|---|---|---|---|
|
Percentage of people(b) who had a GP attendance |
86% |
88% |
1.6 ▲ |
|
Number of GP attendances per 100 people(b) |
578 per 100 people |
632 per 100 people |
9.2 ▲ |
|
Total Medicare benefits paid for GP attendances per 100 people(b)(c)(d) |
$27,300 per 100 people |
$32,158 per 100 people |
17.8 ▲ |
Notes:
(a) Discrepancies may be due to rounding of numbers.
(b) The numerator is the number of people who had a GP attendance and the denominator is the Australian Bureau of Statistics (ABS) Estimated Resident Population (ERP).
(c) Does not include government expenditure on bulk-billing incentives for non-referred attendances. In 2018–19, this amounted to $653 million, or $2,613 per 100 people (Services Australia, 2020). See Technical Note for further details.
(d) Expenditure results are not adjusted for inflation.
Sources: AIHW analysis of Department of Health, Medicare Benefits Schedule (MBS) claims data; ABS ERP.
GP visits continue to vary depending on where people live
The percentage of people who visited a GP in 2018–19 ranged from 76% of people living in the Northern Territory PHN area to 94% in the South Western Sydney PHN area. This pattern remains unchanged since 2013–14, with the Northern Territory PHN area having the lowest percentage of people visiting a GP (72%) and the South Western Sydney PHN area having the highest percentage (94%) (Figure 1). This variation may be due to a range of factors, see Interpreting the data for more details.
Figure 1: Percentage of people who had a Medicare-subsidised GP attendance, by Primary Health Network (PHN) area, 2013–14 and 2018–19
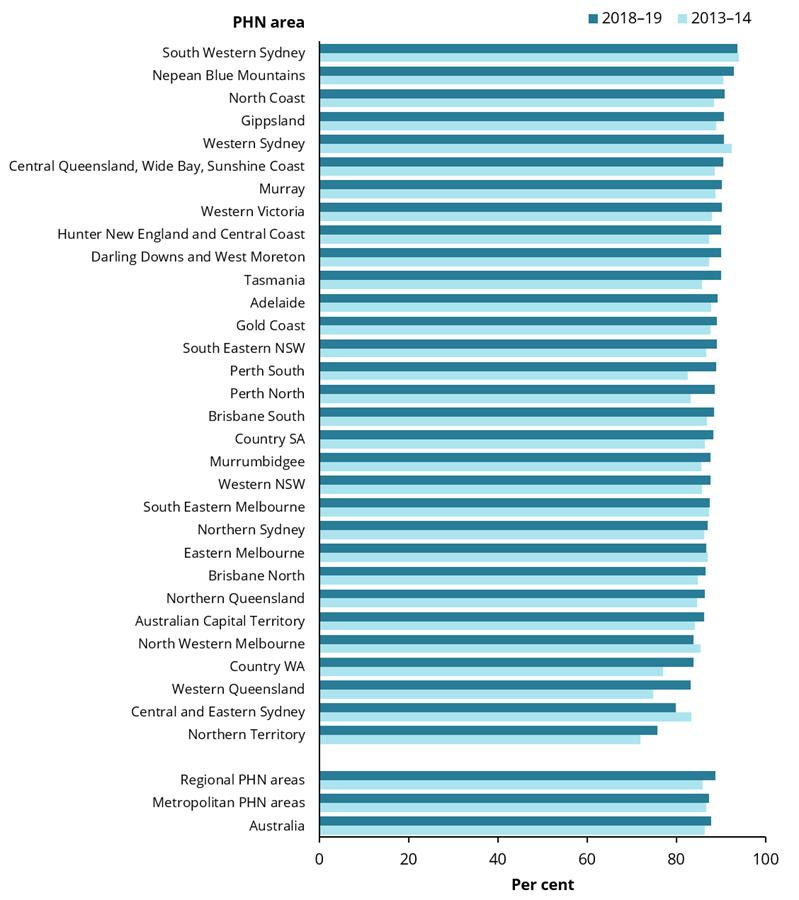
Chart: AIHW. Sources: AIHW analysis of Department of Health, MBS claims data; ABS ERP.
Growth in the proportion of people using GP services in remote areas
In some of the more remote PHN areas, there was a noticeable increase in the proportion of people using GP services between 2013–14 and 2018–19. The largest percentage points increase was in the Western Queensland PHN area which grew from 75% in 2013–14 to 83% in 2018–19, followed by the Country WA PHN area from 77% to 84%.
Other PHN areas in Western Australia including Perth South and Perth North also experienced noticeable percentage point increases in the proportion of people using GP services, from 83% in 2013–14 to 89% in 2018–19.
The largest decrease was in the Central and Eastern Sydney PHN area where 83% of people had a GP visit in 2013–14 compared to 80% in 2018–19. This was followed by the Western Sydney PHN area where 92% of people had a GP visit in 2013–14 which decreased to 91% in 2018–19.
References
Services Australia 2020. Medicare Australia statistics. Canberra: DHS. Viewed 14 July 2020.