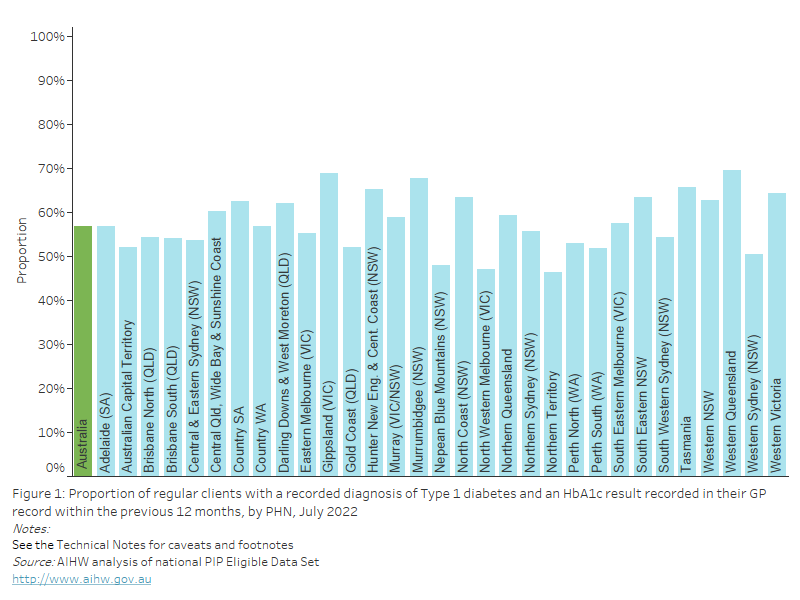
This bar chart shows the proportion of regular clients aged 15 years and over with height and weight recorded in their GP record, by PHN for July 2022.

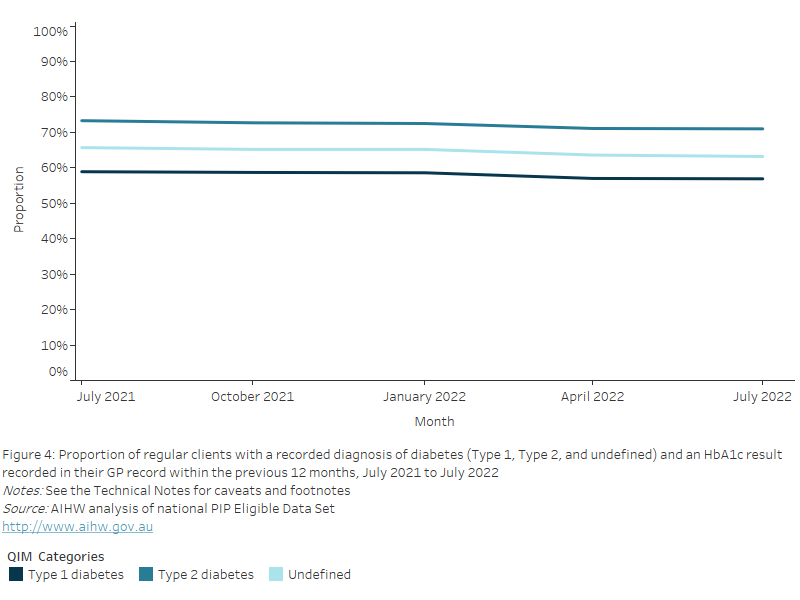
This line chart shows the proportion of regular clients aged 15 years and over with height and weight recorded in their GP record, from July 2021 to July 2022.
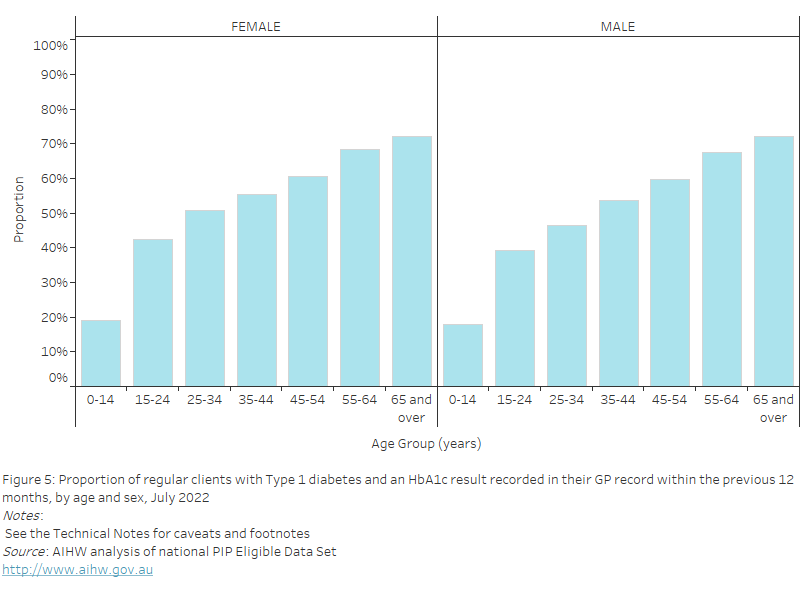
This bar chart shows the proportion of regular clients aged 15 years and over with height and weight recorded in their GP record, by age and sex for July 2022.

This bar chart shows the proportion of regular clients aged 15 years and over with a BMI classification of “underweight”, by PHN for July 2022.
This bar chart shows the proportion of regular clients aged 15 years and over with a BMI classification of “healthy”, by PHN for July 2022.

This bar chart shows the proportion of regular clients aged 15 years and over with a BMI classification of “overweight”, by PHN for July 2022.

This bar chart shows the proportion of regular clients aged 15 years and over with a BMI classification of “obese”, by PHN for July 2022.

This line chart shows the proportion of regular clients aged 15 years and over with a BMI classification (“underweight”, “healthy”, “overweight”, “obese"), from July 2021 to July 2022.

This bar chart shows the proportion of regular clients aged 15 years and over with a BMI classification of “underweight”, by age and sex for July 2022.

This bar chart shows the proportion of regular clients aged 15 years and over with a BMI classification of “healthy”, by age and sex for July 2022.

This bar chart shows the proportion of regular clients aged 15 years and over with a BMI classification of “overweight”, by age and sex for July 2022.

This bar chart shows the proportion of regular clients aged 15 years and over with a BMI classification of “obese”, by age and sex for July 2022.