Suicide rates by age
Ex-serving males and females
The suicide rates for both ex-serving males and females between 2002 and 2019 varied by age at time of suicide death.
Between 2002 and 2019, the suicide rate for ex-serving males aged 50 years and over was lower than ex-serving males under 50 years of age (18.9 and 35.2 per 100,000 population per year). However, ex-serving females suicide rates were similar regardless of age at suicide death.
Figure 4: Suicide rate by age group, ex-serving males and females, 2002–2019

Source: AIHW analysis of linked Defence historical personnel data–PMKeyS–NDI data 1985–2019.
Suicide rates by age compared with the Australian population
The age-specific suicide rates for ex-serving males and females aged 50 years and over were similar to Australian males and females in the same age group. However, the age-specific suicide rates for ex-serving males and females were higher than the Australian population for all age groups under 50. For those under 30, the suicide rate was three times higher for ex-serving females and almost twice as high for ex-serving males. As previously, comparisons are made here with the Australian population to provide context.
|
Age group |
Male ex-serving suicide rate (per 100,000 population per year) |
Male Australian suicide rate (per 100,000 population per year) |
Significant difference to Australian population |
|---|---|---|---|
|
Under 30 |
34.0 |
20.2 |
Yes, Higher |
|
30–39 |
38.1 |
25.5 |
Yes, Higher |
|
40–49 |
33.0 |
26.3 |
Yes, Higher |
|
50 years and over |
18.9 |
20.6 |
No |
Source: AIHW analysis of linked Defence historical personnel data–PMKeyS–NDI data 1985–2019.
|
Age group |
Female ex-serving suicide rate (per 100,000 population per year) |
Female Australian suicide rate (per 100,000 population per year) |
Significant difference to Australian population |
|---|---|---|---|
|
Under 30 |
20.3 |
6.6 |
Yes, Higher |
|
30–39 |
12.1 |
7.4 |
Yes, Higher |
|
40–49 |
19.2 |
8.6 |
Yes, Higher |
|
50 years and over |
9.0 |
6.6 |
No |
Source: AIHW analysis of linked Defence historical personnel data– PMKeyS–NDI data 1985–2019.
Suicide rate by age over time
There is some fluctuation over time in the suicide rates by age group, however the majority of differences are not statistically significant. There has, however, been an increase in the suicide rates for ex-serving males aged 30–39 years from 27.9 in 2012–2014 to 49.9 per 100,000 population per year in 2017–2019.
Due to the small number of suicide deaths among ex-serving females, suicide rates by age over time are not reported for these subgroups.
The suicide rate for ex-serving males, by age group, is compared with the rate for Australian males in the same age range in the interactive graph below. Select an age group from the menu to display the comparison.
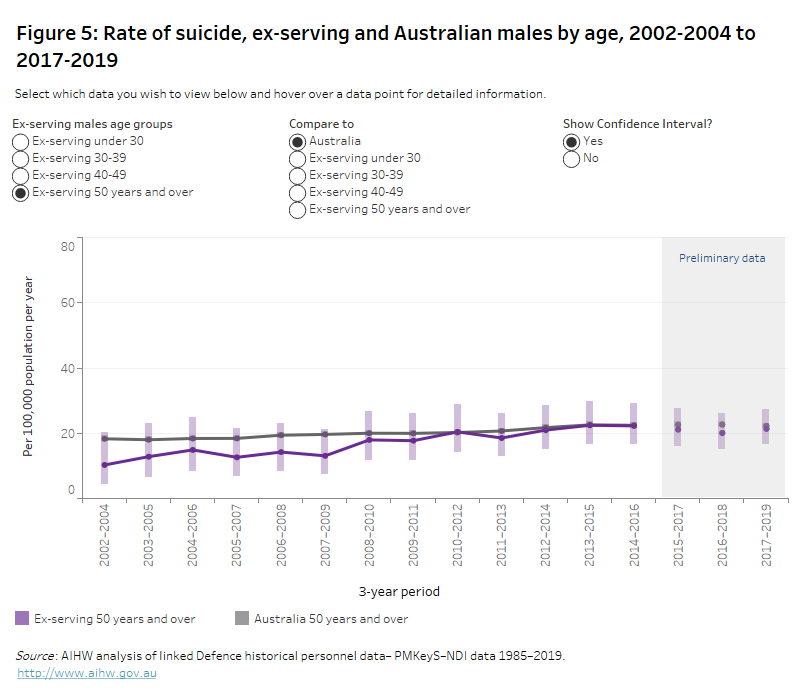
Note: The confidence intervals in this figure can be used to determine the significance of differences between the suicide rates calculated for the ex-serving and Australian populations within a given 3-year period. However, they cannot be used to determine the significance of differences between rates calculated for the ex-serving (or Australian) population for overlapping 3-year time periods (for example 2002–2004 and 2003–2005).
Data underlying this graph are available in Supplementary table S6.2. See Data for a link to the tables.
Please note, data for recent years are subject to change; see Technical notes for further detail.
Suicide rates by age and service status
Permanent and reserve males suicide rates were similar regardless of their age at suicide death.
|
Age group(a) |
Permanent suicide rate (per 100,000 population per year) |
Reserve suicide rate |
Ex-serving suicide rate |
|---|---|---|---|
|
Under 30 |
12.6 |
11.3 |
34.0 |
|
30–39 |
9.9 |
14.6 |
38.1 |
|
40 years and over |
10.3 |
11.8 |
37.1 |
|
40–49 |
n.p. |
12.8 |
33.0 |
|
50 years and over |
n.p. |
10.7 |
18.9 |
Notes
n.p. Not available for publication but included in totals where applicable, unless otherwise indicated.
- Due to the small number of suicide deaths among permanent males at the older ages, the upper age limit is presented at 40 years and over as the data was unable to be disaggregated further.
Source: AIHW analysis of linked Defence historical personnel data–PMKeyS–NDI data 1985–2019
Figure 6: Male suicide rate by age group and service status, 2002–2019

Source: AIHW analysis of linked Defence historical personnel data–PMKeyS–NDI data 1985–2019.
Due to the small number of suicide deaths among females, suicide rates by age group and service are not reported.
Suicides by Service
The ADF comprises three Services: the Royal Australian Navy (Navy), Australian Army (Army) and the Royal Australian Air Force (Air Force). An individual can serve in more than one service during their ADF career, and individuals can transfer between Services throughout. This section describes the Service at the time of separation for ex-serving members.
The majority of ex-serving members were in the Army at the time of separation (68.4% for males and 62.5% for females). At the same time, 16.0% of males and 17.8% of females were in the Navy, and 15.5% of males and 19.7% of females were in the Air Force.
The rates of suicide for ex-serving females were similar across the three Services. However, the rate of suicide for ex-serving males who separated from the Air Force was lower than for ex-serving males who separated from the Army or the Navy.
|
Service |
Ex-serving males: |
Ex-serving females: |
|---|---|---|
|
Navy |
33.1 |
15.2 |
|
Army |
30.9 |
16.6 |
|
Air Force |
21.7 |
9.5 |
Source: AIHW analysis of linked Defence historical personnel data–PMKeyS–NDI data 1985–2019.
Figure 7: Suicide rate by Service, ex-serving males and females, 2002–2019

Source: AIHW analysis of linked Defence historical personnel data–PMKeyS–NDI data 1985–2019.
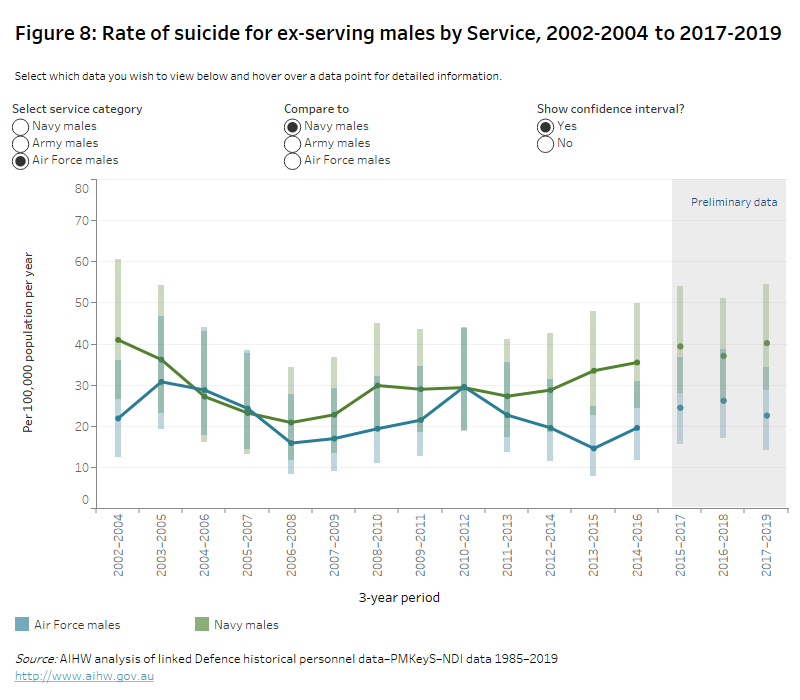
The following graphs show how suicide rates for ex-serving males by Service vary over time. While there is some fluctuation, small numbers mean that there are no significant differences.
Due to small number of suicide deaths among ex-serving females, suicide rates over time are not reported.
The interactive graph below presents the suicide rates for ex-serving males in each of the Service groups, for all 3-year periods from 2002-2004 to 2017-2019.