Suicides by rank
Rank describes organisational and workforce structures that determine a member’s position, conditions, opportunities, and entitlements (such as pay and conditions). This analysis is based on rank at time of separation. In previous reports, rank has been presented in two broad groups: commissioned officers and all ranks other than commissioned officer. In this report, ranks other than officer will be subcategorised into senior, and junior other ranks.
Around 86% of ex-serving males were in the other ranks group at time of separation, (71% were junior other ranks, and 16% were senior other ranks). For females, 86% of ex-serving members were in the other ranks group, (79% were junior other ranks, and 7% were senior other ranks). For both males and females 14% of the ex-serving cohort were officers.
The suicide rates for these groups are given in Table 10 below.
| Rank at time of separation | Ex-serving males: Suicide rate per 100,000 population per year | Ex-serving females: Suicide rate per 100,000 population per year |
|---|---|---|
| Commissioned officer(a) | 16.3 | 12.4 |
| Senior ranks other than commissioned officer(b) | 19.6 | 14.7 |
| Junior ranks other than commissioned officer(c) | 36.4 | 15.8 |
Notes:
- For the purposes of this analysis this is a Defence member who holds a rank of Midshipman or Officer Cadet, or higher.
- A Defence member who holds an equivalent rank to E06 (Petty Officer, or Sergeant) to E10 (Warrant Officer of the Navy, Regimental Sergeant Major of the Army, or Warrant Officer of the Air Force).
- A Defence member who holds an equivalent rank to E00 (Recruit Seaman, Private, or Aircraftman) to E05 (Leading Seaman, or Corporal).
Source: AIHW analysis of linked Defence historical personnel data–PMKeyS–NDI data 1985–2020.
Between 1997 and 2020, the suicide rates for ex-serving males who were commissioned officers or senior other ranks at the time of separation was approximately half that of those who were junior other ranks (16.3 and 19.6 respectively compared with 36.4 per 100,000 population per year).
For ex-serving females, rates of suicide were similar for commissioned officers, and senior and junior other ranks (grouped close between 12 and 16 per 100,000 population per year). This is shown in Figure 16 below.
Figure 16: Suicide rate by rank, ex-serving males and females, 1997–2020
![]()
Source: AIHW analysis of linked Defence historical personnel data–PMKeyS–NDI data 1985–2020.
Suicide rate by rank over time
Rates of suicide for ex-serving males who separated as junior other ranks shows a drop between the late 1990s and the mid 2000s, which is consistent with patterns observed in the general Australian male population over this period (see Figure 3).
Analysis of suicide rates among commissioned officers is based on a small number of suicide deaths. Results have not been reported where there were less than five suicides in the 3-year periods, 2004 to 2006 and 2005 to 2007. Similarly, the 3-year period 2001 to 2003 for senior other ranks has been suppressed for the same reason.
Due to small numbers of suicide deaths among ex-serving females, suicide rates by rank over time are not reported.
The interactive graph below (Figure 17) presents the suicide rates for ex-serving males in each of the rank groups, for all 3-year periods from 1997-1999 to 2018-2020.
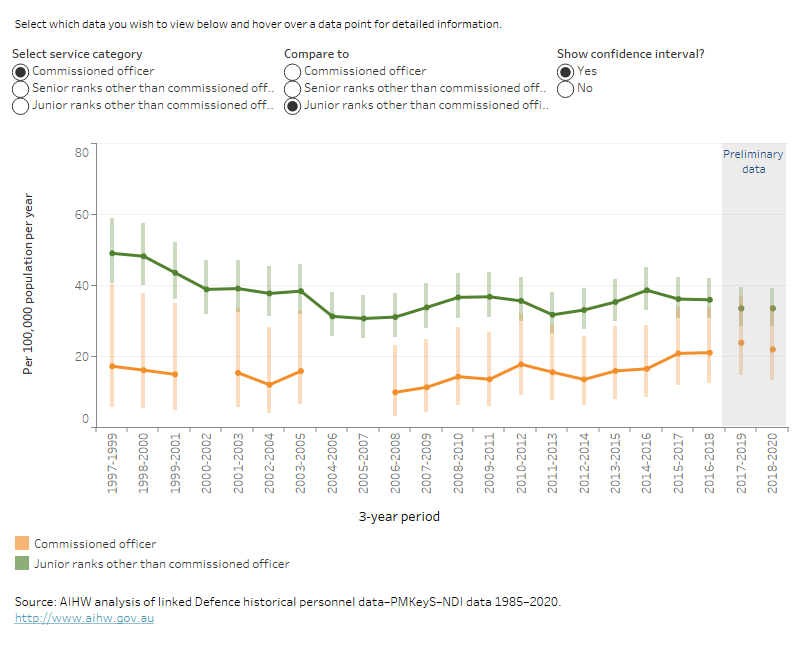
Figure 17: Rate of suicide for ex-serving males by rank, 1997–1999 to 2018–2020
This time series line graph shows the weighted average suicide rate per 100,000 population per year of by rank in ex-serving males over time by 3-year periods from 1997 to 1999, to 2018 to 2020.