How many medical practitioners are there?
Supply of medical practitioners in the workforce
The supply of medical practitioners is calculated in terms of the number of 'full-time equivalent' (FTE) practitioners working in medicine (termed 'employed medical practitioners' in this report), which is based on the total hours worked reported by medical practitioners in the Medical Workforce Survey. The Medical Workforce Survey contains information on medical practitioners who are registered with the Medical Board of Australia through the National Registration and Accreditation Scheme (NRAS) introduced on 1 July 2010.
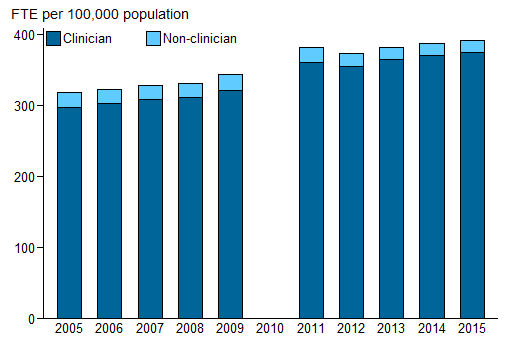
The supply of employed medical practitioners continued to grow in 2015. It was 392 FTE per 100,000 population in 2015, up from 374 per 100,000 in 2012, 382 per 100,000 in 2013 and 388 per 100,000 in 2014, an average annual growth rate of 1.6% from 2012 to 2015.
This continued a trend that was apparent prior to the introduction of the NRAS; when the supply of employed practitioners rose from 319 FTE per 100,000 population in 2005 to 345 per 100,000 population in 2009, an average annual growth rate of 1.9% from 2005 to 2009 (Figure 1).
The supply of practitioners working as clinicians was also higher in 2015 (375 FTE per 100,000) than it was in 2012, 2013 and 2014 (355, 365 and 371 per 100,000, respectively), an average annual growth rate of 1.8% from 2012 to 2015.
Figure 1: Employed medical practitioners: FTE per 100,000 population, by main field of medicine, 2005 to 2015
Notes
- Data prior to 2010 have been presented to show trends for the period before the introduction of the National Registration and Accreditation Scheme. In 2010, due to transitional arrangements, survey data were not available for Western Australia and Queensland. As a result, national data are not available.
- Provisional registration is granted to medical practitioners to enable them to complete a period of supervised practice or internship to be eligible for general registration. This type of registration is intended for practitioners who have completed a Medical Board-approved, accredited qualification in the profession. Data prior to 2010 were based on state/territory-based registration systems and treatment of provisional registrants was not consistent across the jurisdictions. Data for 2011 include 2,945 provisional registrants. From 2012, data exclude provisional registrants.
- FTE is based on total weekly hours worked. Standard working week is 40 hours.
- Clinician is a medical practitioner who spends the majority of their time working in the area of clinical practice.
Sources: AIHW Medical Labour Force Survey (2005 to 2009); National Health Workforce Data Set (NHWDS): medical practitioners (2011 to 2015).
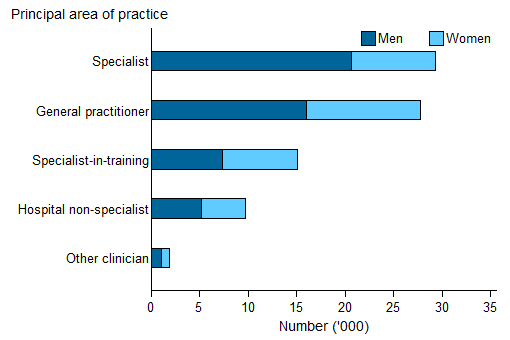
The largest proportion of clinicians were specialists (35.0%), followed by general practitioners (33.1%), specialists-in-training (18.0%) and hospital non-specialists (11.6%) (Figure 2).
The supply of clinician general practitioners was relatively stable between 2012 and 2015 at around 110 FTE per 100,000 population (112 FTE per 100,000 population in 2015).
The supply of clinician specialists increased between 2012 and 2015, from 128 to 134 per 100,000 population.
Figure 2: Number of employed clinician medical practitioners, by principal area of practice and sex, 2015
Source: NHWDS: medical practitioners 2015.
Registered and employed medical practitioners
There were 102,805 registered medical practitioners (including provisionally registered) in 2015. Of these, most held a 'general registration' (83,427). Many of them also had a 'specialist registration' (49,060) (Table 1).
| Registration type | Number | Average age (years) | Women (per cent) |
|---|---|---|---|
| General | 34,367 | 36.9 | 50.9 |
| General and specialist | 49,060 | 52.7 | 34.6 |
| Limited | 2,988 | 39.2 | 39.7 |
| Non-practicing | 2,665 | 58.2 | 40.2 |
| Provisional | 5,339 | 28.9 | 52.3 |
| Specialist | 8,386 | 48.2 | 33.0 |
| Total | 102,805 | 45.6 | 41.1 |
Source: NHWDS: medical practitioners 2015.
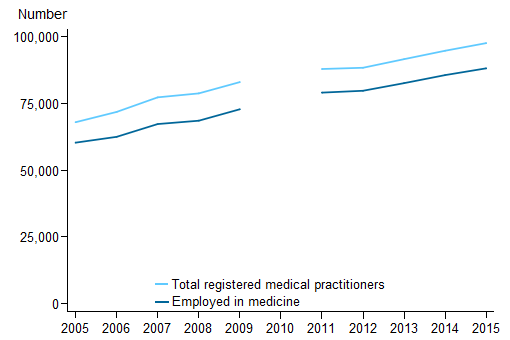
The total number of registered medical practitioners increased by 43.6% between 2005 and 2015, from 67,890 to 97,466 (excluding provisionally registered), an average annual change of 3.7% from 2005 to 2015. The number of practitioners employed in medicine increased by 46.1% over the same period, from 60,252 to 88,040, an average annual change of 3.9% from 2005 to 2015 (Figure 3).
Figure 3: Medical practitioners: registered practitioners and practitioners employed in medicine, 2005 to 2015
Notes
- Data prior to 2010 have been presented to show trends for the period before the introduction of the National Registration and Accreditation Scheme. In 2010, due to transitional arrangements, survey data were not available for Western Australia and Queensland. As a result, national data are not available.
- Provisional registration is granted to medical practitioners to enable them to complete a period of supervised practice or internship to be eligible for general registration. This type of registration is intended for practitioners who have completed a Medical Board-approved, accredited qualification in the profession. Data prior to 2010 were based on state/territory-based registration systems and, as a result, treatment of provisional registrants was not consistent across the jurisdictions. Data for 2011 include 2,945 provisional registrants. From 2012, data exclude provisional registrants.
Sources: AIHW Medical Labour Force Survey (2005 to 2009); National Health Workforce Data Set (NHWDS): medical practitioners (2011 to 2015).
Among the 88,040 medical practitioners employed in medicine in Australia, 83,731 (95.1%) reported being clinicians (Figure 4).
Figure 4: Medical practitioners: workforce status, 2015
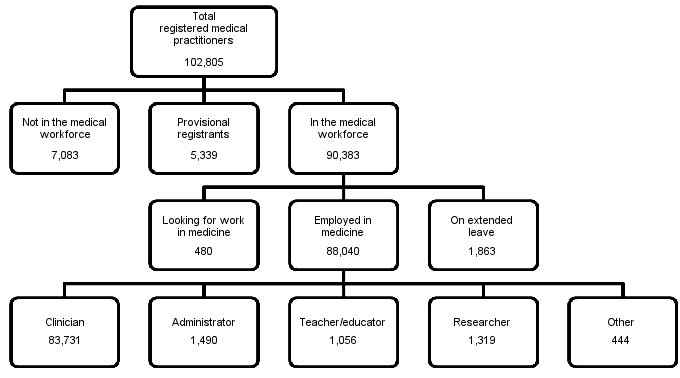
Note: Clinician is a medical practitioner who spends the majority of their time working in the area of clinical practice.
Source: NHWDS: medical practitioners 2015.
States and territories
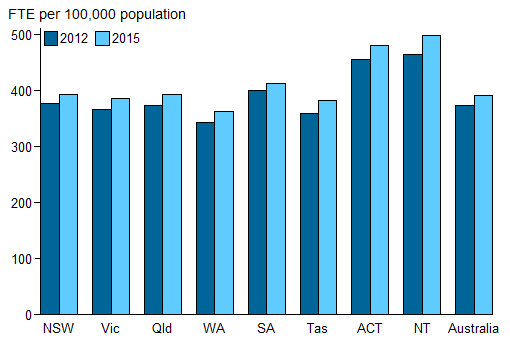
In 2015, the overall supply of medical practitioners working in medicine varied across the states and territories, from 363 FTE employed medical practitioners per 100,000 population in Western Australia to 499 in the Northern Territory (Figure 5).
From 2012 to 2015, the supply of employed medical practitioners increased slightly in all jurisdictions. The greatest increase was in the Northern Territory (7.2%) followed by Tasmania (6.4%), with the smallest increase in South Australia (2.8%). Data in the Northern Territory can be affected by a high rate of migration of the workforce in and out of the jurisdiction. There was an increase in the national supply of employed practitioners over the same period of 5.0% (Figure 5).
Figure 5: Employed medical practitioners: FTE per 100,000 population, by jurisdiction, 2012 and 2015
Notes
- Derived from 'state and territory of main job' where available; otherwise, 'state and territory of principal practice' is used as a proxy. If state and territory details are unavailable, 'state and territory of residence' is used. Records with no information on all 3 locations are included in Australian totals.
- Data exclude provisional registrants. Provisional registration is granted to medical practitioners to enable them to complete a period of supervised practice or internship to be eligible for general registration. This type of registration is intended for practitioners who have completed a Medical Board-approved, accredited qualification in the profession.
- FTE is based on total weekly hours worked. Standard working week is defined as 40 hours.
Source: NHWDS: medical practitioners, 2012 and 2015.
Remoteness areas
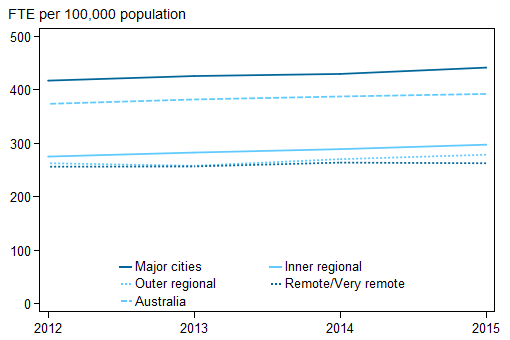
Major cities continued to have the highest rate of supply of employed medical practitioners of all the remoteness areas (Figure 6).
Figure 6: Employed medical practitioners: FTE per 100,000 population, by remoteness area, 2012 to 2015
Notes
- Derived from 'remoteness area of main job' where available; otherwise, 'remoteness area of principal practice' is used as a proxy. If remoteness area details are unavailable, 'remoteness area of residence' is used. Records with no information on all 3 locations are included in Australian totals.
- Data exclude provisional registrants. Provisional registration is granted to medical practitioners to enable them to complete a period of supervised practice or internship to be eligible for general registration. This type of registration is intended for practitioners who have completed a Medical Board-approved, accredited qualification in the profession.
- Remote/Very remote areas include Migratory areas.
- FTE is based on total weekly hours worked. Standard working week is defined as 40 hours.
Source: NHWDS: medical practitioners (2012 to 2015).
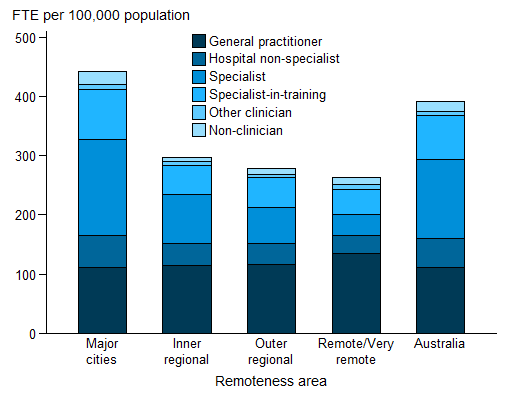
In 2015, the overall supply of employed medical practitioners varied across remoteness areas, from 442 FTE per 100,000 population in Major cities to 263 in Remote/Very remote areas (Figure 7).
While supply of medical practitioners overall was lowest in Remote/Very remote areas, the supply of general practitioners was the highest in Remote/Very remote areas in 2015. The supply of general practitioners in Remote/Very remote areas was 136 FTE per 100,000 population, 24 more than the national rate of 112. This does not necessarily imply remote and very remote populations are better off in terms of access to general practitioner services. These differences may reflect different service delivery models and higher levels of demand in some areas.
Figure 7: Employed medical practitioners: FTE per 100,000 population: principal area of practice, remoteness area, 2015
Notes
- Derived from 'remoteness area of main job' where available; otherwise, 'remoteness area of principal practice' is used as a proxy. If remoteness area details are unavailable, 'remoteness area of residence' is used. Records with no information on all 3 locations are included in Australian totals.
- Remote/Very remote areas include Migratory areas.
- FTE is based on total weekly hours worked. Standard working week is defined as 40 hours.
Source: NHWDS: medical practitioners 2015.