South Australia
Quick facts
On an average day in 2019–20, in South Australia:
- 224 young people aged 10 and over were under youth justice supervision
- 11 per 10,000 young people aged 10–17 were under supervision
- Indigenous young people were 21 times as likely to be under supervision as non-Indigenous young people.
Of those under youth justice supervision in South Australia on an average day:
- 85% were supervised in the community, and the rest in detention
- 84% were male
- 50% of those aged 10–17 were Aboriginal or Torres Strait Islander
- 81% of those in detention were unsentenced awaiting the outcome of their court matter or sentencing
Young people spent an average of 21 weeks under supervision during the year.
Over the 5 years to 2019–20, the number of young people under supervision on an average day fell by 25%, while the rate for those aged 10–17 fell from 16 to 11 per 10,000.
Box: Impact of COVID-19 on youth justice data
This report includes data from the COVID-19 period, between March and June 2020. However, more data is required to determine the impact of COVID-19 on the youth justice system.
Number and rate
On an average day in 2019–20, in South Australia:
- 224 young people aged 10 and over were under youth justice supervision
- most (85%) were supervised in the community, and the rest (16%) in detention (proportions might not sum to 100% because some young people were under community-based supervision and in detention on the same day)
- the rate of supervision was 11 per 10,000 young people aged 10–17
- 9.2 per 10,000 young people aged 10–17 were under community-based supervision, and 2.0 per 10,000 were in detention.
Age and sex
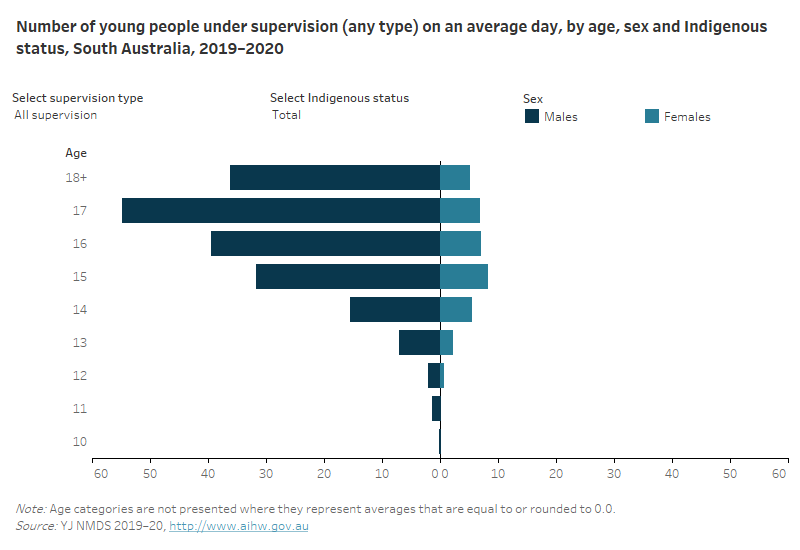
On an average day in 2019–20, in South Australia:
- 82% of those under supervision were aged 10–17, and the rest were 18 and over
- more than 4 in 5 (84%) of those under supervision were male
- males under supervision were most likely to be aged 17, and females 15.
Box: Updated age calculation on an average day
For 2019–20, the age calculation for the average daily population has been changed. Age is now calculated based on the age a young person is each day that they are under supervision. If a young person changes age during a period of supervision, then the average daily number under supervision will reflect this. Due to this change in methodology, average daily data with an age selection or breakdown will not be comparable to previous Youth justice in Australia releases.
Aboriginal and Torres Strait Islander young people
On an average day in 2019–20, in South Australia:
- Indigenous young people made up 5% of those aged 10–17 in the general population, but 50% of those of the same age under supervision
- Indigenous young people aged 10–17 were 21 times as likely as non-Indigenous young people to be under supervision (118 per 10,000 compared with 5.7 per 10,000)
- Indigenous over-representation was similar in detention (21 times the non‑Indigenous rate).
Time under supervision
In 2019–20, in South Australia:
- the median duration of individual periods of supervision completed during the year was 53 days (almost 8 weeks)
- when all time spent under supervision during the year is considered, young people spent an average of 148 days (21 weeks) under supervision.
Sentenced and unsentenced detention
On an average day in 2019–20, in South Australia:
- About 4 in 5 (81%) young people in detention were unsentenced—that is, they were awaiting the outcome of their court matter, or had been found guilty and were awaiting sentencing
- 20% of young people in detention were serving a sentence (the proportion of unsentenced and sentenced young people on an average day does not sum to 100% as young people may have changed legal status on the same day).
Trends to 2019–20
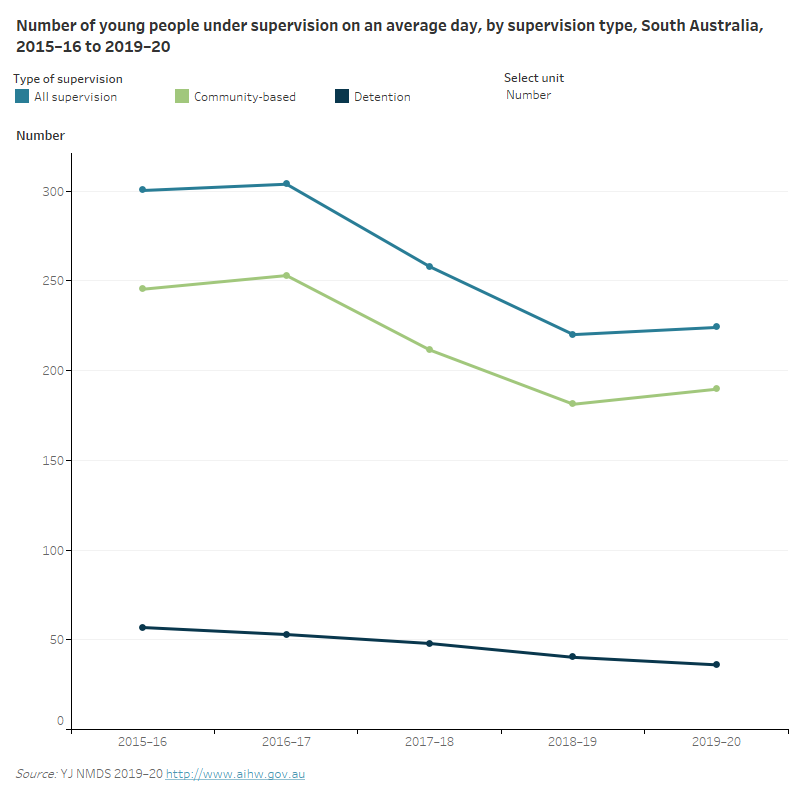
Over the 5 years to 2019–20, on an average day, in South Australia:
- the number of young people under supervision fell by 25% (from 300 in 2015–16 to 224 in 2019–20), while the rate dropped from 16 to 11 per 10,000 young people aged 10–17
- in community-based supervision, the number fell by 23% (from 245 in 2015–16 to 190 in 2019–20), while the rate fell from 13 to 9.2 per 10,000
- in detention, the number fell 37%, while the rate fell from 3.2 to 2.0 per 10,000
- the rate of Indigenous young people under supervision fell overall (174 to 118 per 10,000, with a high of 190 in 2016–17).
More information
For more information see Youth Justice.