Prescribers
On this page:
Medical personnel, such as general practitioners and medical specialists, prescribe opioid pharmacotherapy. Each state and territory has a registration process through which prescribers can undergo training and become registered or authorised to prescribe opioid pharmacotherapy to clients. For more information on registered and authorised prescribers, see the Glossary.
Data on all registered or authorised prescribers are included in this report, except for New South Wales, Western Australia and South Australia, where prescribers are included only if they are actively prescribing to at least 1 client on the snapshot day. These 3 jurisdictions have prescribers who prescribe in more than 1 location, and as such are counted more than once. This will lead to slightly reduced client to prescriber ratios. For more details about the collection, refer to Table T2 in the Technical notes.
What were the numbers and types of opioid pharmacotherapy prescribers?
Most prescribers were authorised to prescribe more than one type of opioid pharmacotherapy drug.
On a snapshot day in 2022, there were 2,982 authorised prescribers of opioid pharmacotherapy drugs in Australia. Of these prescribers:
- Almost 2 in 3 (63% or 1,870 prescribers) were authorised to prescribe more than 1 type of drug.
- Over 1 in 7 (13% or 378 prescribers) were authorised to prescribe buprenorphine-naloxone only.
- 1 in 10 (10%) prescribers were authorised to prescribe methadone only (Figure PRESCRIBER1, Tables S15 and S16).
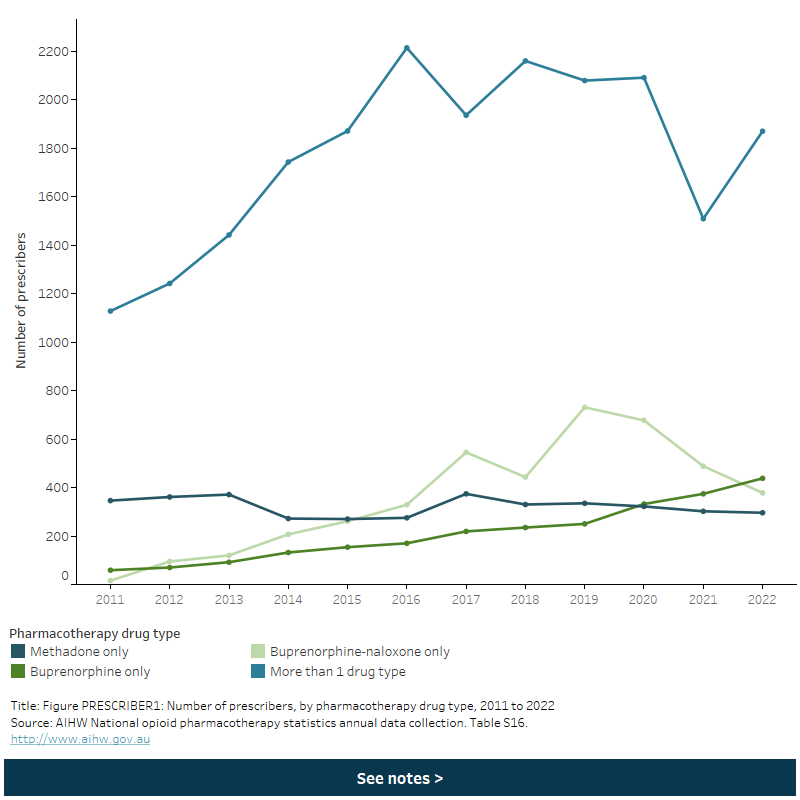
Figure PRESCRIBER1: Number of prescribers by pharmacotherapy drug type, 2011 to 2022
Between 2011 and 2022, most prescribers were registered to prescribe more than 1 drug type (1,870 prescribers in 2022). Between 2011 and 2022, the number of prescribers prescribing methadone only decreased. Conversely, the number of prescribers prescribing buprenorphine only or buprenorphine-naloxone only increased. Data for 2021 exclude Queensland.
Refer to the Data tables for more information.
Between 2011 and 2020, there was a 121% increase in the total number of authorised prescribers (from 1,549 prescribers to 3,422). However, the total number of authorised prescribers dropped by 13% from 2021 to 2022 (2,982 prescribers) (Figure PRESCRIBER1; Table S16). Across this period:
- The number of prescribers authorised to prescribe more than 1 type of drug increased overall, though this fluctuated over time.
- The number of prescribers authorised to prescribe methadone only, was lower in 2022 (296 prescribers) than in 2011 (346).
Where did opioid pharmacotherapy prescribers work?
Most opioid pharmacotherapy prescribers worked in the private sector.
Prescribers are classified according to the sector in which they are working when prescribing pharmacotherapy drugs to clients:
- Private prescribers work in organisations that are not part of government, such as private general practice clinics.
- Public prescribers work in organisations that are part of government or are government-controlled, such as public drug and alcohol clinics and public hospitals.
- Correctional facility prescribers work in prisons or other correctional services.
On a snapshot day in 2022, 4 in 5 prescribers (80% or 2,382 prescribers) worked in the private sector. The remainder worked in the public sector (15% or 462 prescribers), correctional facilities (4.6% or 137), or a combination of sectors (less than 1%) (Table PRESCRIBER1).
| Prescriber type | NSW | Vic | Qld | *WA | SA | Tas | ACT | NT | Total |
|---|---|---|---|---|---|---|---|---|---|
| Public prescriber | 247 | — | 129 | 35 | 23 | 8 | 9 | 11 | 462 |
| Private prescriber | 815 | 1,083 | 190 | 61 | 157 | 21 | 54 | 1 | 2,382 |
| Public/private prescriber | — | — | — | — | — | 1 | — | — | 1 |
| Correctional facility | 63 | 17 | 17 | 20 | 11 | 2 | 6 | 1 | 137 |
| Total | 1,125 | 1,100 | 336 | 116 | 191 | 32 | 69 | 13 | 2,982 |
— Nil or rounded to zero.
Notes
- 'Public/private prescriber' relates to prescribing that cannot be separated into a single prescriber type.
- The states and territories have different guidelines and policies regarding training and registration to prescribe opioid pharmacotherapy types.
Refer to the Technical notes for more information.
Source: AIHW National Opioid Pharmacotherapy Statistics Annual Data collection. Table S15.
Of the 55,741 clients receiving pharmacotherapy treatment in Australia in 2022, almost 2 in 3 (62% or 34,570 clients) received treatment from a private prescriber. A further 26% (14,379 clients) received treatment from a public prescriber and 10% (5,481) from a correctional facility prescriber (Table S12).
Across most jurisdictions with available data, the most common prescriber type among clients receiving pharmacotherapy was private prescriber (ranging from 46% of clients in the Australian Capital Territory to 91% in Victoria). The Northern Territory was the exception, where 9 in 10 clients (97%) were treated by public prescribers (Table S3).
How many clients did opioid pharmacotherapy prescribers treat?
On a snapshot day in 2022, prescribers treated an average of 19 opioid pharmacotherapy clients each.
On a snapshot day in 2022, prescribers treated an average of 19 clients each nationally. Western Australia had the highest number of clients per prescriber (26 clients), while the Northern Territory, Australian Capital Territory and Victoria had the lowest (all had 14 clients each) (Figure PRESCRIBER2).
Between 2017 and 2022, the ratio of clients per prescriber decreased in New South Wales, Queensland and Western Australia (all decreasing by 8-10% in each state per prescriber).
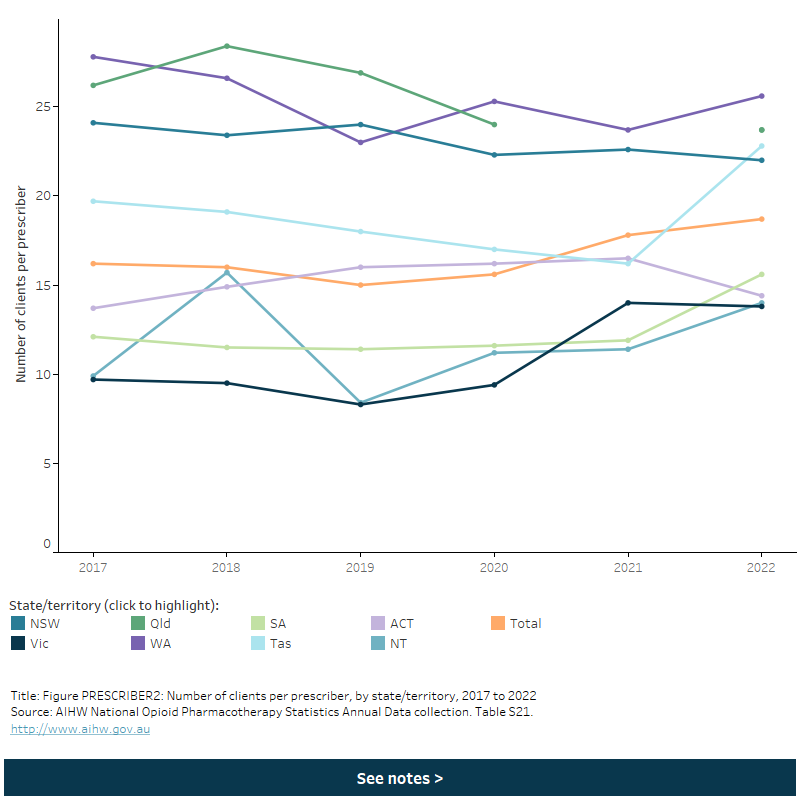
Figure PRESCRIBER2: Number of clients per prescriber, by state/territory, 2017 to 2022
The ratio of clients per prescriber varied by state and territory. Nationally, the number of clients per prescriber increased from 16.2 in 2017 to 18.7 in 2022. On a snapshot day in 2022, Western Australia had the highest number of clients per prescriber (25.6 clients), while Victoria had the lowest (13.8 clients).
Refer to the Data tables for more information.
Nationally, on average prescribers working in the public sector had about twice as many clients as prescribers in the private sector (31 and 14 clients per prescriber, respectively) (Table S22).
Nationally, client to prescriber ratios in private sectors remained relatively stable between 2019 and 2022 (Table S22). In 2022, private prescribers had a lower average number of clients than public prescribers in all jurisdictions except Queensland. Victoria had no public prescribers.
Nationally, prescribers working in correctional facilities had an average of 40 clients each in 2022. This varies widely at the state and territory level, from 3 clients per prescriber in Queensland to 75 in Victoria (Table PRESCRIBER2).
In the public sector, the Australian Capital Territory had the highest ratio of clients to prescribers (50 clients) followed by Western Australia (38). In the private sector, Queensland had the highest ratio of clients to prescribers (26 clients per prescriber).
| Prescriber type | NSW | Vic | Qld | WA | SA | Tas | ACT | NT | Total |
|---|---|---|---|---|---|---|---|---|---|
| Public prescriber | 36.1 | — | 22.5 | 37.9 | 19.1 | 19.5 | 50.3 | 16.0 | 31.1 |
| Private prescriber | 15.2 | 12.8 | 26.3 | 16.8 | 8.8 | 19.0 | 8.6 | 1.0 | 14.5 |
| Public/private prescriber | — | — | — | — | — | 121.0 | — | — | 121.5 |
| Correctional facility | 54.6 | 75.1 | 3.1 | 17.4 | 21.2 | 27.0 | 12.2 | 5.0 | 40.0 |
| Total | 22.0 | 13.8 | 23.7 | 25.6 | 15.6 | 22.8 | 14.4 | 14.0 | 18.7 |
— Nil or rounded to zero.
Notes
- This ratio was calculated using the formula: number of clients by prescriber type and state/territory (Table S3) divided by registered prescribers by prescriber type and state/territory (Table S15).
- WA and SA have prescribers who prescribe in more than 1 location, and as such are counted more than once. This will lead to slightly deflated client to prescriber ratios in these jurisdictions.
Source: AIHW National Opioid Pharmacotherapy Statistics Annual Data collection. Table S22.
On a snapshot day in 2022, almost 6 in 10 prescribers (59% or 1,774 prescribers) treated 1–5 clients. Just over 1 in 8 prescribers (12% or 363) treated more than 50 clients. Most of these prescribers were in New South Wales and Victoria (Table S19).
Across states and territories, the proportion of pharmacotherapy prescribers treating 1–5 clients ranged from 28% (93 prescribers) in Queensland to 71% (135 prescribers) in South Australia. Around 4% of prescribers were not treating any clients on the snapshot day; prescribers with 0 clients were reported for Queensland and the Australian Capital Territory in 2022 (Tables PRESCRIBER3 and S19).
| Clients per prescriber | NSW | Vic | Qld | WA | SA | Tas | ACT | NT | Total | Total (%) |
|---|---|---|---|---|---|---|---|---|---|---|
| 0 pharmacotherapy clients | — | — | 106 | — | — | — | 12 | — | 118 | 4.0 |
| 1–5 pharmacotherapy clients | 736 | 717 | 93 | 49 | 135 | 11 | 26 | 7 | 1,774 | 59.5 |
| 6–10 pharmacotherapy clients | 73 | 89 | 33 | 17 | 18 | 5 | 9 | 1 | 245 | 8.2 |
| 11–15 pharmacotherapy clients | 42 | 43 | 17 | 11 | 11 | — | 4 | 1 | 129 | 4.3 |
| 16–20 pharmacotherapy clients | 33 | 39 | 9 | 3 | 8 | 4 | 2 | — | 98 | 3.3 |
| 21–25 pharmacotherapy clients | 25 | 27 | 9 | 4 | 4 | 2 | 4 | 2 | 77 | 2.6 |
| 26–50 pharmacotherapy clients | 66 | 57 | 23 | 10 | 7 | 6 | 7 | 2 | 178 | 6.0 |
| 51–100 pharmacotherapy clients | 71 | 56 | 24 | 16 | 6 | 3 | 4 | — | 180 | 6.0 |
| 101+ pharmacotherapy clients | 79 | 72 | 22 | 6 | 2 | 1 | 1 | — | 183 | 6.1 |
| Total | 1,125 | 1,100 | 336 | 116 | 191 | 32 | 69 | 13 | 2,982 | 100.0 |
— Nil or rounded to zero.
Notes
- Prescribers classified as treating '0 pharmacotherapy clients' on a snapshot day must have held an authority to prescribe and had a client who was receiving treatment during the collection year.
Source: AIHW National Opioid Pharmacotherapy Statistics Annual Data collection. Table S19.
Did pharmacotherapy drug treatment vary between prescriber types?
While methadone was the most common pharmacotherapy treatment across all prescriber types, private prescriber clients were the most likely to receive methadone and correctional clients the most likely to receive buprenorphine LAI.
Pharmacotherapy treatment type
In 2022, methadone was the most commonly prescribed drug across all prescriber types except for public/private prescribers. However, there were some differences in the proportion of clients receiving each pharmacotherapy drug type by prescriber type:
- A higher proportion of clients of private prescribers were prescribed methadone (56% or 19,317 clients) compared to clients of public prescribers (47% or 6,707 clients) and clients in correctional facilities (33% or 1,818 clients).
- A higher proportion of clients in correctional facilities were prescribed buprenorphine LAI (13% or 731 clients) compared to clients of public (7% or 996 clients) or private prescribers (6% or 2,092 clients) (excludes NSW data) (Table S12).
In New South Wales, clients prescribed buprenorphine-naloxone or buprenorphine LAI are reported as receiving buprenorphine. As such, the proportion of clients receiving buprenorphine nationally is overestimated.
Client characteristics
In 2022, unit record data was available for 6 states and territories (excluding data for Victoria and Queensland). These data indicate that, compared to clients of public or private prescribers, clients of prescribers in correctional facilities were more likely to be:
- Younger: correctional facilities treated clients aged under 30 at 3.2 times the rate of public prescribers and 3.9 times that of private prescribers.
- Correctional facilities treated clients aged 30–39 years at 1.7 times the rate of public prescribers and 2.0 times the rate of private prescribers. This has remained relatively stable since 2016.
- Almost 1 in 8 (12%) clients treated in correctional facilities were aged 50 years and over, compared to over 1 in 3 clients treated by public prescribers (35%) and over 2 in 5 by private prescribers (42%) (Table S27).
- Male: correctional facilities treated about 9 males for every female. Public and private prescriber types each treated about twice as many males as females (Table S28).