Summary
This report presents information on:
- service type outlets1 that are funded to deliver CSTDA services
- characteristics of the people who use CSTDA-funded services
- support needs and informal carers of people using CSTDA-funded services.
The data source for this information is the 2004 - 05 Commonwealth State/Territory Disability Agreement National Minimum Data Set (CSTDA NMDS) collection, for the period 1 July 2004 to 30 June 2005.
Data on each previous annual collection have been published by the AIHW. For more information, see the reference section of this report and the AIHW web site (www.aihw.gov.au).
Service users and service groups
There were 200,493 users of CSTDA-funded services during 2004 - 05 (Table 1.1). Victoria recorded the highest percentage of service users (38%), followed by New South Wales (23%) and Queensland (14%). This pattern is generally in keeping with the size of the total population in each state and territory.
Of the five service groups, the most commonly accessed was community support, used by 46% of all service users (Table 1.1). Service types in this group include therapy support, early childhood intervention and case management. Employment services were the next most commonly accessed service group (32%), followed by community access (22%) and accommodation support (17%) services. A further 12% of service users accessed respite services. Patterns of service usage varied among jurisdictions.
| Service group | NSW | Vic | Qld | WA | SA | Tas | ACT | NT | Total | % |
|---|---|---|---|---|---|---|---|---|---|---|
| Accommodation support | 5,980 | 13,199 | 5,034 | 3,371 | 4,550 | 1,128 | 338 | 190 | 33,787 | 16.9 |
| Community support | 19,082 | 33,521 | 8,497 | 16,511 | 9,832 | 1,943 | 2,508 | 910 | 92,610 | 46.2 |
| Community access | 6,761 | 19,540 | 6,392 | 4,431 | 4,863 | 1,513 | 374 | 305 | 44,166 | 22.0 |
| Respite | 4,129 | 11,150 | 3,761 | 2,744 | 1,470 | 265 | 287 | 182 | 23,951 | 11.9 |
| Total state/territory services | 28,521 | 60,069 | 16,432 | 19,499 | 15,447 | 3,658 | 3,087 | 1,350 | 147,748 | |
| Employment | 19,037 | 18,567 | 12,340 | 6,151 | 5,919 | 1,768 | 793 | 395 | 64,835 | 32.3 |
| Total service users | 45,148 | 75,110 | 27,229 | 23,346 | 19,612 | 5,154 | 3,753 | 1,655 | 200,493 | |
| Total per cent | 22.5 | 37.5 | 13.6 | 11.6 | 9.8 | 2.6 | 1.9 | 0.8 |
Notes
- Service user data are estimates after use of a statistical linkage key to account for individuals who received services from more than one service type outlet during the 12-month period from 1 July 2004 to 30 June 2005. Totals for each state/territory may not be the sum of components since individuals may have accessed services in more than one service group during the 12-month period. Totals for Australia may not be the sum of the components since individuals may have accessed services in more than one state or territory during the 12-month period.
- Service user data were not collected for all CSTDA service types (see Section 2.2 for details).
- Employment totals do not include the 804 people categorised as 'independent workers' during the 2004-05.
- A service type outlet is the unit of a CSTDA-funded agency that delivers a particular CSTDA service type at or from a discrete location.
Service users
Sex and age
Around 56% of service users were male (Table 3.5). There were more males than females in all 5-year age groups, with the exception of those aged 70 years and over (Figure 3.1). The largest number of service users was in the 20 - 24 year age bracket, for both males and females.
Females had a higher median age than males in all five service groups (Figure 3.2). The overall difference in median ages was 5.7 years - 35.1 years for females and 29.4 years for males (Appendix Table A1.9). The overall median age of CSTDA service users increased by 0.5 years between 2003 - 04 and 2004 - 05 - from 30.4 years to 30.9 years (Figure 3.3).
Disability groups
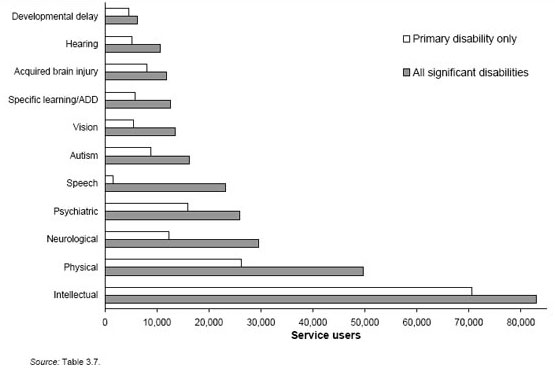
Intellectual disability was the most commonly reported disability group, both in terms of the reported primary disability (35%) and overall (when considering reporting of both primary and 'other significant' disabilities) (41%) (Tables 3.4 and 3.7; Figure 1.1). Physical disability was the next most frequently reported group (13% as a primary disability and 25% overall). Psychiatric disability was the third most commonly reported primary disability group (8%), and neurological the third overall (15%).
Males were more likely than females to report a primary disability of autism, acquired brain injury or specific learning/ADD; females were more likely to report neurological or vision as their primary disability (Table 3.4).
The average number of disability groups reported per service user was 1.7 (including primary) - ranging from 1.2 for those reporting psychiatric or hearing as their primary disability to 2.0 for those with an acquired brain injury (Table 3.6).
Indigenous status
Around 3.1% of service users reported that they were of Aboriginal and/or Torres Strait Islander origin (Table 3.8). This proportion ranged from 1.3% in Victoria and the Australian Capital Territory to 31% in the Northern Territory. Indigenous users were more likely to be in younger age groups (0 - 19 years) than non-Indigenous service users (Figure 3.5). This finding is consistent with the younger age profile of the Indigenous population generally, when compared with the non-Indigenous population.
Indigenous service users were more likely to report developmental delay as a primary disability group than non-Indigenous service users (6.1% compared with 2.6%). They were less likely to report psychiatric as their primary disability group (5.4% compared with 9.5%) (Table 3.9). Apart from this, patterns of reporting primary disability groups for Indigenous service users were similar to those reported by non-Indigenous users.
Communication method and need for interpreter services
Overall, 63% of service users reported spoken language as their most effective method of communication. Little or no effective communication was reported by 13% of service users, and 2% reported effective sign language (Table 3.12). More than four-fifths of service users (82%) reported that they did not need an interpreter (Table 3.14). Around 2.7% of service users reported needing an interpreter for non-spoken communication and 1.5% for spoken language other than English. (This data item was missing for 14.1% of service users.) Of those service users needing an interpreter for non-spoken communication, 55% had little or no effective communication, and 29% used effective sign language.
Figure 1.1 Users of CSTDA-funded services, primary disability group and all significant disability groups, 2004-05
Income source and labour force status
Almost three-fifths (59%) of service users aged 16 years and over reported that the Disability Support Pension was their main source of income, followed by other pensions or benefits (10%) and paid employment (9%) (Table 3.16). (This data item was not reported for 20% of service users aged 16 years and over.)
There were 156,828 service users aged 15 years and over - of these, 35% were not in the labour force, 32% were employed, and 21% were unemployed (Table 3.17).
For more than half (52%) of service users under the age of 16 years it was not known whether the carer allowance (child) was received (Table 3.15); a further 35% of service users in that age group reported a parent/guardian was receiving this allowance.
Location
The rate of people accessing CSTDA-funded services was highest in inner regional areas (12.4 service users per 1,000 population aged under 65 years), followed by outer regional (10.8), major cities (10.4), remote (8.9) and very remote areas (6.9) (Table 3.20).
Presence of an informal carer
A total of 84,964 service users (42%) reported that they had an informal carer (i.e. a person such as a family member, friend or neighbour, who provides unpaid care and assistance on a regular and sustained basis). Respite service users had the highest proportion of service users with an informal carer (86%), and employment service users the lowest (30%) (Table 4.1).
The proportion of service users with an informal carer decreased with age, and reporting of an informal carer was very similar between males and females (Figure 4.1).
Age and relationship of informal carers
Over two-thirds of carers were reported to be the mother of a service user (68%), followed by father (7%) and other female relative (6%) (Table 4.3). Almost half (49%) of informal carers whose age was reported were aged between 25 and 44 years, and 37% were aged between 45 and 64 years. A further 12% were aged 65 years and over (Table 4.4).
Primary status and co-residency of carers
An informal carer was considered to be a 'primary carer' if he or she assisted the service user in one or more of three activities of daily living - self-care, mobility or communication. Over two-thirds (67%) of service users who reported having an informal carer indicated that the person was a primary carer. Primary informal carers were much more likely to be co-resident than non-primary carers (90% compared with 49%) (Table 4.6).
Support needs
Information was collected concerning service users' overall support needs in each of nine life areas: self-care; mobility; communication; interpersonal interactions and relationships; learning, applying knowledge and general tasks and demands; domestic life; education; community (civic) and economic life; and working.
Within these life areas, the largest proportions of service users always needing support were in the areas of working (24%), education (22%) and community (civic) and economic life (21%). Life areas with the largest proportions of service users needing no assistance were the three activities of daily living - mobility (36%), self-care (31%) and communication (28%) (Table 4.7).
When the nine life areas were grouped into three more general areas, the proportion of service users always needing assistance was highest for activities of work, education and community living (AWEC) (33%), followed by activities of independent living (AIL) (28%) and activities of daily living (ADL) (24%) (Table 4.7).
Living arrangements and residential setting
More than half (56%) of all service users lived with their family, 19% with others and 12% alone (Table 4.9). Service users reporting living with others had the highest support needs in all three broad life area groupings (AWEC, AIL and ADL), followed by those living with family (Figure 4.3).
A total of 137,238 service users (68%) lived in a private residence (Table 4.10). Of these, 104,056 (76%) lived with their family.
Service outlets
A total of 8,448 service type outlets were identified as providing CSTDA-funded services during 2004 - 05 (Table 5.1). Of these, around two-thirds (67%) were non-governmentprovided services.
There were 7,651 state/territory-funded service type outlets, almost half (48%) of which provided accommodation support services (Table 5.2). Most state/territory-funded outlets were in Victoria (2,570), followed by New South Wales (1,600) and Queensland (1,513). There were 797 Australian government-funded outlets in 2004 - 05 - most (89%) of these provided employment services (Table 5.3).
During 2004 - 05, most service type outlets operated 7 or more hours a day (80%), 5 days (40%) or 7 days (46%) a week, for 48 or more weeks (92%) each year (Tables 5.4, 5.5 and 5.6).
Service use
Of those service types that collected hours of service received, the mean overall hours received per outlet were 266 in the reference week and 364 in a typical week (Tables 6.1 and 6.2). Respite outlets reported the highest mean number of hours received during both the reference week (478) and a typical week (690), and community support outlets the lowest (148 and 142 respectively).
Users of residential accommodation support services (such as group homes or institutional accommodation) recorded a mean duration of service of 307 days, and a median duration of 365 days during 2004 - 05 (Table 6.3).
About 29% of service users accessed services from multiple outlets during 2004 - 05 (Table 6.6). Just over one-fifth of service users (22%) accessed services from more than one service group - the most common combination being accommodation support and community access services (Tables 6.6 and 6.9). The most commonly combined service types were therapy support for individuals and case management, local coordination and development (Table 6.10).
Exiting services
There were 42,534 service users (21%) who recorded an exit date in one or more service outlet during 2004 - 05 (Table 6.11). Employment service users were most likely to record an exit date (24%); respite and community access service users were the least likely (both 9%). The most commonly reported reason for exiting a service was no longer needing assistance, reported by 33% of exiting service users.
Government expenditure
Government expenditure on CSTDA-funded services during 2004 - 05 totalled $3.6 billion, or $3.3 billion when identified administration expenditure is excluded (Table 1.2). Amounts paid to state/territory governments by the Australian Government are included in state/territory totals for Table 1.2.
Accommodation support services accounted for 50% of the total expenditure on CSTDA services in 2004 - 05 ($1,799 million). Community access services received around $419 million (12%), community support $399 million (11%), employment $325 million (9%) and respite $197 million (5%). 'Other' support services received a total of $137 million (4%) and advocacy, information and print disability services $45 million (1%). A further $300 million (8%) went towards administrative costs.
| Service group $ million |
NSW | Vic | Qld | WA | SA | Tas | ACT | NT | Aus Gov | Australia | |
|---|---|---|---|---|---|---|---|---|---|---|---|
| Accommodation support | 652.8 | 515.5 | 233.3 | 158.3 | 142.7 | 54.9 | 27.5 | 13.8 | - | 1,798.8 | |
| Community support | 85.6 | 146.1 | 53.7 | 49.9 | 33.9 | 9.1 | 11.0 | 9.9 | - | 399.2 | |
| Community access | 125.8 | 165.9 | 61.3 | 22.5 | 16.4 | 13.2 | 3.6 | 2.1 | 7.7(a) | 418.6 | |
| Respite | 65.6 | 46.5 | 40.3 | 19.6 | 8.9 | 5.9 | 4.0 | 1.5 | 4.5(a) | 196.7 | |
| Employment | - | - | - | - | - | - | - | - | 324.5 | 324.5 | |
| Advocacy, information and print disability | 8.0 | 7.2 | 6.6 | 2.2 | 4.0 | 2.0 | 0.9 | 0.1 | 14.1 | 45.1 | |
| Other support | 2.1 | 41.5 | 3.9 | 14.3 | 13.6 | 1.0 | 1.7 | 0.1 | 58.9 | 137.0 | |
| Subtotal | 940.0 | 922.7 | 399.1 | 266.6 | 219.4 | 86.1 | 48.7 | 27.5 | 409.7 | 3,319.9 | |
| Administration | 112.0 | 81.7 | 38.2 | 14.7 | 5.2 | 5.4 | 8.5 | 1.2 | 32.6 | 299.5 | |
| Total | 1,052.0 | 1,004.5 | 437.3 | 281.3 | 224.6 | 91.4 | 57.2 | 28.8 | 442.3 | 3,619.4 | |
- Australian government-funded community access and respite services are not funded under the CSTDA. They are funded under the Disability Services Act Discretionary Fund.
Note: Figures may vary from those published in the Report on government services 2006 (SCRCSSP 2006) owing to the use of different counting rules in particular jurisdictions (e.g. some jurisdictions may include funding for psychiatric-specific services in Table 1.2 but not in SCRCSSP 2006).
Sources: SCRCSSP 2006; and unpublished data provided to AIHW from each jurisdiction.
Data quality
The overall service type outlet response rate was 94%, varying in the range 70 - 100% among jurisdictions (Table 7.1). 'Not stated' rates for data items varied widely and should be considered when interpreting data (Tables 7.2 to 7.4). National Disability Administrators are supporting initiatives to enhance data quality.