Technical notes
Summary
Background
What is apparent consumption?
This publication quantifies the amount of alcohol being made available to people living in Australia every year. Rather than measuring the drinking habits of individuals, the apparent consumption of alcohol collection examines the availability of alcohol across Australia. While this does not allow for examination of results below the national level, or for disaggregations by priority population groups, it does allow for long-term trends in the total amount of beer, wine, cider and spirits entering the Australian community to be examined.
While the total amount of alcohol being made available in a given year does not directly translate to individual consumption patterns, changes in availability are likely to reflect broad changes in consumption patterns. Apparent consumption trends are therefore useful for indicating whether the Australian community is drinking more or less alcohol on average than previously, and how different beverage types have contributed to the total amount of alcohol being consumed.
Results within this publication should be interpreted in relation to the time-series rather than used for absolute values of the amount of alcohol that was consumed each year, due to limitations in the data sources and assumptions made:
- The collection assumes that all alcohol that was produced or imported in a given financial year was consumed in the same financial year.
- No data is available to account for beverages that may have been wasted, used in cooking, cellared, or otherwise not consumed.
- The collection does not account for beverages that were purchased overseas and brought into the country duty-free.
Previous publications
This publication is a continuation of the long-running Apparent Consumption of Alcohol, Australia series previously run by the Australian Bureau of Statistics (ABS). For an explanation of the previous calculation methods, see the ABS website (2019b).
Revisions to results
Results in this publication are subject to change as data sources are updated and revised over time. Data sources are discussed for each beverage type below.
Summary of major data changes in this publication
Wine estimates
The method for estimating apparent consumption of wine has been updated to incorporate Wine Equalisation Tax data and the wine Consumer Price Index series. This method was chosen due to similarities in results when compared to the apparent consumption of wine timeseries (Figure 2).
As a result, wine data is no longer estimated from actual sales but estimated based on taxation data, similar to the methodology for beer and spirits. Apparent consumption of wine estimates from 2014–15 have been recalculated and will not match previously published results.
While care has been taken to ensure consistency in estimation methods, comparisons before and after this change should be made with caution. For more details, see the Apparent consumption of wine section below.
Beer estimates
Two tariff items for domestically produced beer have been combined into a single item. This publication has recalculated all estimates since 2006–07 using the combined tariff items, resulting in small differences to previously published results.
Methods for calculating the alcohol from imported beer have also been updated. The amount of alcohol is now directly calculated from customs duty data items, rather than estimated using an average alcohol strength for imported beer. This may cause small changes in apparent consumption of alcohol from beer in all years since 2005–06.
For more details, see the Apparent consumption of beer section below.
Cider estimates
No changes have been made to the way that cider is calculated in the apparent consumption of alcohol collection. However, as cider estimates are calculated using data from the other beverage categories, changes in beer and wine estimates result in changes to cider estimates for the same financial years. For more details, see the Apparent consumption of cider section below.
Apparent consumption of beer
Data sources
The apparent consumption of alcohol considers the availability of beer from three sources:
- Domestically produced beer that is intended to be sold in Australia.
- Internationally produced beer that is imported into Australia.
- Note that this excludes beer that is imported into Australia only to be exported to another country.
- Homebrewed beer created in non-commercial premises.
Each of these sources of beer uses estimates from different data sources to calculate the total amount of beer being made available to people living in Australia in each financial year.
Domestically produced beer brewed in commercial premises
All beer produced in Australia in commercial premises attracts an excise, according to the amount of alcohol in the beer. The Australian Taxation Office (ATO) is responsible for collecting this information and publishes excise data on data.gov.au.
For all commercial, domestically produced beer, the first 1.15% of alcohol content does not attract an excise. To adjust for this, an average alcohol strength of beer in each excise category is sought from industry members. The alcohol strengths used in 2019–20 estimates are shown in Table 1.
Beer category | Average alcohol content |
|---|---|
Low strength packaged beer (ABV > 1.15% and ≤ 3.0%) | 2.41% |
Mid strength packaged beer (ABV > 3.0% and ≤ 3.5%) | 3.44% |
Full strength packaged beer (ABV > 3.5%) | 4.60% |
Low strength tap/bulk beer (ABV > 1.15% and ≤ 3.0%) | 2.46% |
Mid strength tap/bulk beer (ABV > 3.0% and ≤ 3.5%) | 3.47% |
Full strength tap/bulk beer (ABV > 3.5%) | 4.60% |
Note: For more information on the category definitions for beer, see ATO (2023).
Source: AIHW 2023.
These alcohol strengths are used in conjunction with the ATO excise data to estimate the total amount of beer, and of alcohol in the form of beer, produced in Australia in each financial year.
Note that it is assumed that all beer produced in a given financial year is made available in that financial year. Everything that attracts beer excise is included, so other beverages that fall into this excise category (for example some seltzers) are defined as beer for the purposes of the apparent consumption of alcohol collection.
Imported beer
Beer that is imported into Australia attracts customs duty at the same rates as the domestically produced beer excise duties. Both the total volume of beer and the total amount of alcohol attracting customs duty are captured by the Department of Home Affairs.
In this case, as the total volume of beer is also captured in the data, it is possible to calculate the amount of alcohol exempt from duty without using an estimate of the average alcohol strengths for each excise category. For more information on specific import clearance items, see ABS (2018) appendix 6.2.
Note that everything that attracts beer customs duties is included in the beer category, so other beverages that meet this definition (for example some seltzers) are defined as beer for the purposes of the apparent consumption of alcohol collection. Beer stored in bonded warehouses and subsequently exported is excluded from the collection.
Homebrewed beer
Homebrewed beer (beer brewed in non-commercial premises) is not excised, so no direct data source on the total amount brewed is available. Instead, it is estimated as a proportion of the total amount of domestically produced beer. This proportion is reviewed periodically: it was initially based on a survey of home production of Foodstuffs (ABS 1992) and was revised to 2.2% in 2008.
Methodological changes
Domestic beer produced in commercial premises for non-commercial purposes
In previously published results, the two tariff items for beer brewed on commercial premises for non-commercial purposes were used separately in calculations. These were:
- 1.15 – Beer produced for non-commercial purposes using commercial facilities or equipment, alcohol volume not exceeding 3%.
- 1.16 – Beer produced for non-commercial purposes using commercial facilities or equipment, alcohol volume over 3%.
The available data combines these tariff items into a total number of litres of alcohol produced for non-commercial purposes. Historically, a vast majority of this alcohol fell under the category of tariff item 1.16, with only a small fraction having alcohol not exceeding 3%.
As a result, the apparent consumption of alcohol collection now assumes that all beer brewed for non-commercial purposes is full strength, causing a slight change to apparent consumption of alcohol estimates for beer. The AIHW has used this method to calculate apparent consumption of beer back to 2006–07, when the tariff items first came into effect. This ensures that the time-series is not broken by this change in calculation approach.
Published estimates for apparent consumption of alcohol from beer will be slightly different to those previously published by the Australian Bureau of Statistics from 2006–07 to 2017–18.
Accounting for the duty-free component of alcohol in imported beer
The previous calculation method for imported alcohol in the form of beer required the use of an estimated average Alcohol by Volume (ABV) amount for imported beer. This allowed for an estimate of the amount of alcohol that did not attract customs duty (1.15% of all imported beer) to be calculated.
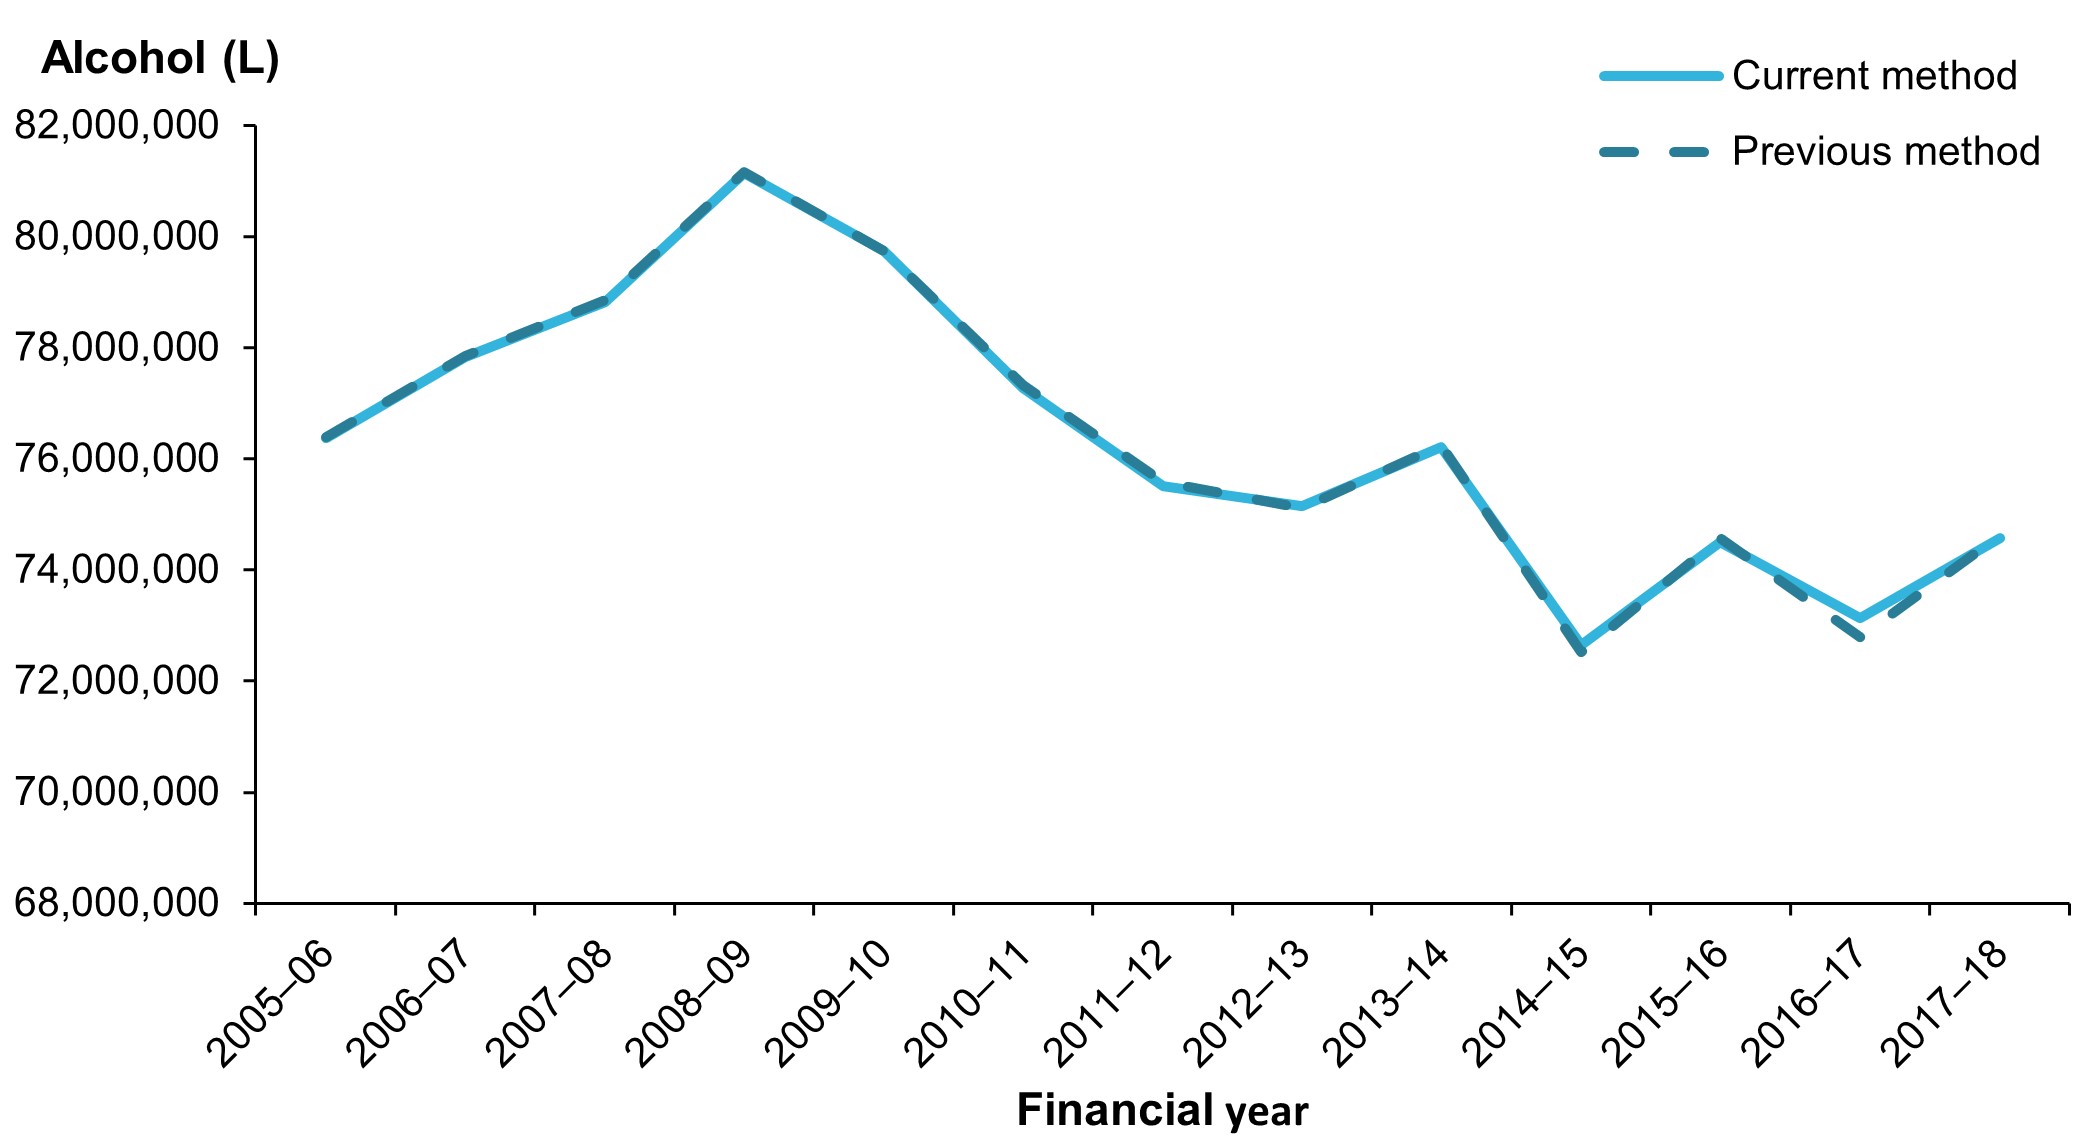
On review of the data sources, it was found that the first 1.15% of all imported beer could be calculated directly from the total imported amount of beer, without the need for an average ABV estimation. This had the benefits of requiring fewer data sources and allowing for an exact estimation of the amount of alcohol. Additionally, this change in methodology gave very similar results to the previous calculation method as shown in Figure 1.
Figure 1: Comparison of alcohol from beer as calculated by the previous and current methods for accounting for duty-free alcohol in imported beer.
Source: AIHW 2023.
This method has been applied to results from 2005–06 to 2019–20. Some results for litres of alcohol in the form of beer may be different from those previously published, most noticeably in 2016–17.
Apparent consumption of wine
Data sources
Prior to 2014–15, apparent consumption of wine estimates were based on the Shipments of Wine and Brandy in Australia by Australian Winemakers and Importers collection (ABS 2014). This involved collecting sales information directly from winemakers and importers and had very high coverage of the wine sold in Australia.
The final year of this collection was 2013–14, and apart from a survey run by the ABS in 2015–16, no other direct surveys of winemakers and importers have been run. As a result, a new set of data sources was required to calculate apparent consumption of wine.
Wine Equalisation Tax and apparent consumption of wine
While beer can be calculated based on excise data, this has not historically been possible with wine. This is because wine is taxed according to the Wine Equalisation Tax (WET), which is calculated as a proportion of the price of the wine rather than a proportion of the amount of alcohol in the beverage, as beer and spirits are. As a result, WET data cannot be used to calculate the amount of wine that was made available in a given financial year.
If it is not possible to directly measure how much wine is sold or produced in a given financial year, then the next best approach is to use data to project the amount of wine being sold from the previous surveys. This is where WET data becomes useful.
Total WET collected can increase for one of two reasons:
- More wine is sold; or
- People pay more money for the same amount of wine.
Given this, if the average price of the wine is accounted for, then the changes in the WET amounts should correspond to changes in the amount of wine being sold.
This publication uses two data sources in this approach:
- Wine Equalisation Tax data, collected by the Australian Taxation Office and published on their website (2022c).
- Consumer Price Index (CPI) data for wine, as published by the ABS (2023a).
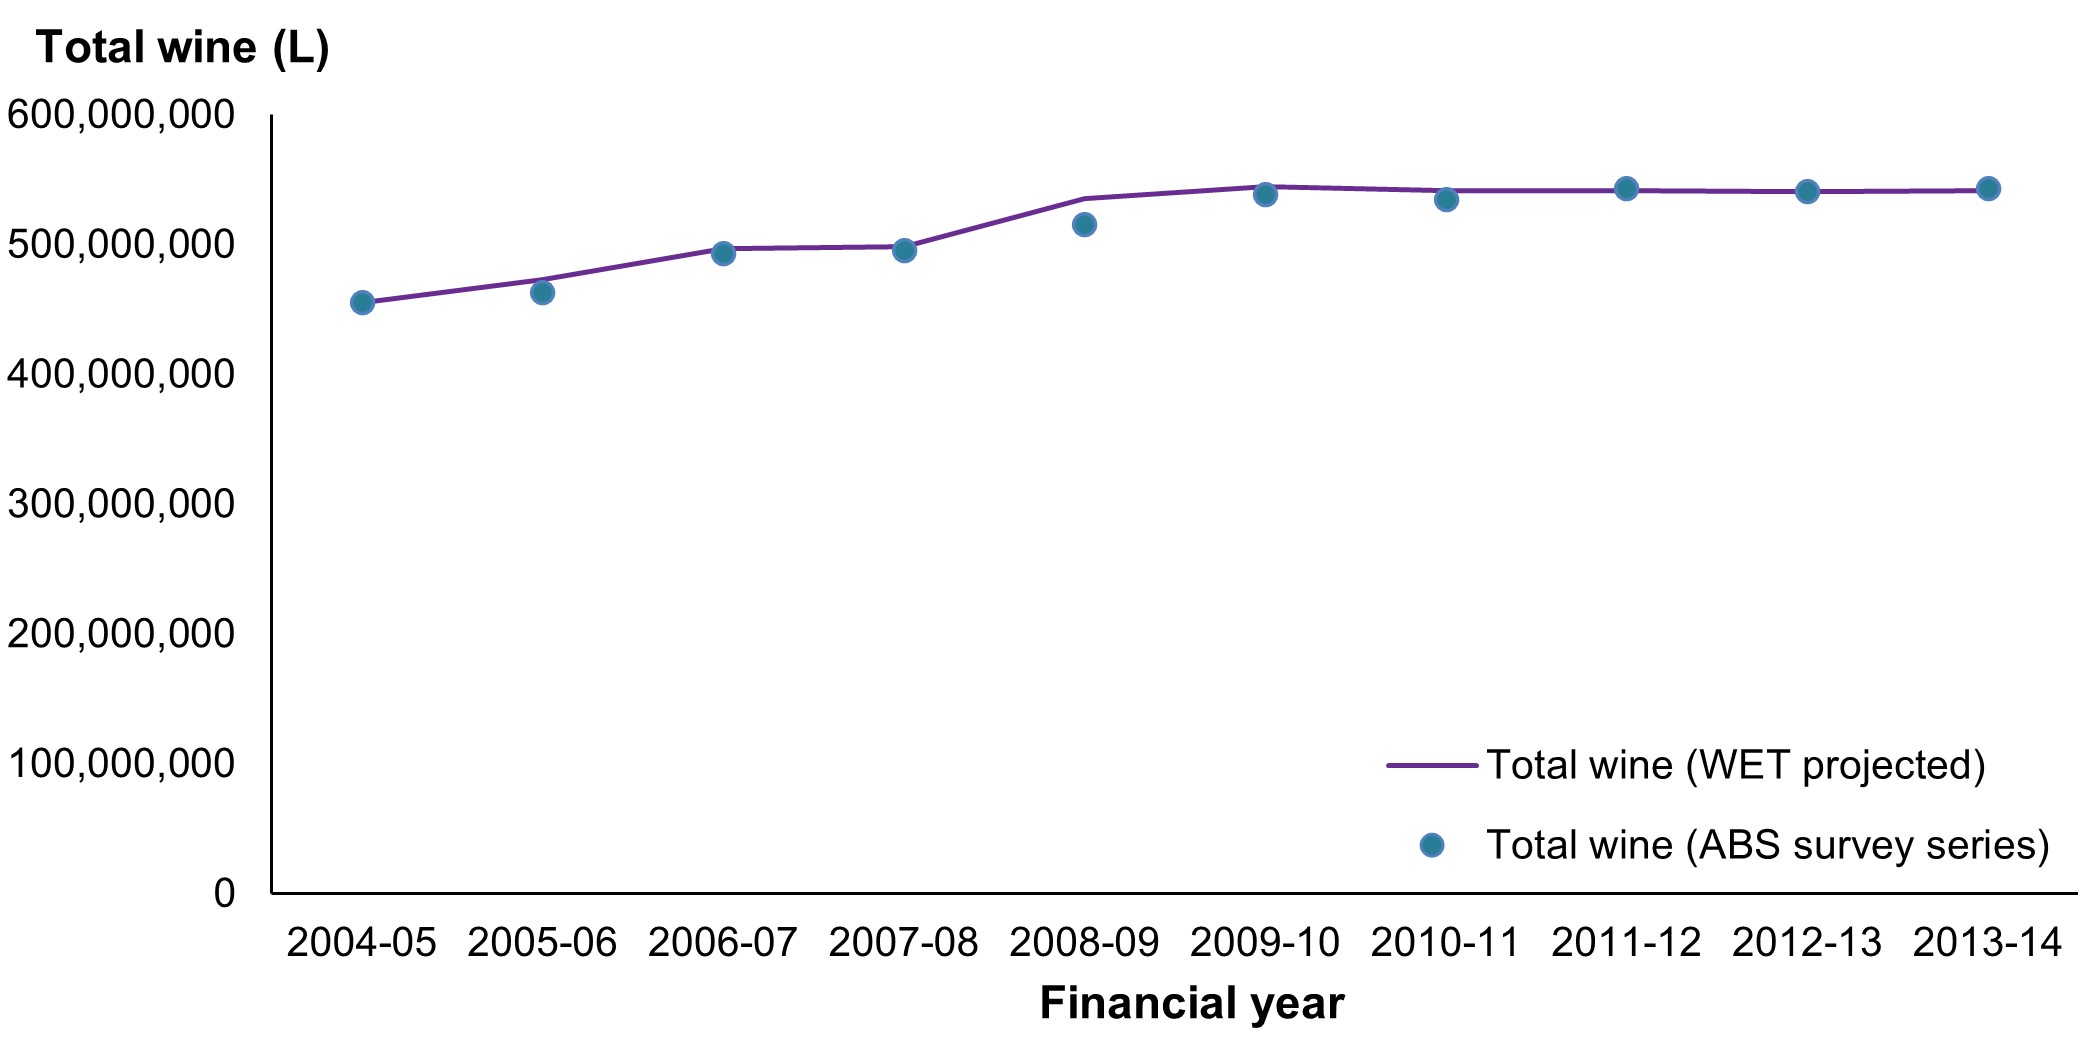
Previous estimates from the Shipments of Wine and Brandy in Australia by Australian Winemakers and Importers (ABS 2014) are projected into future years, using WET data and accounting for wine price changes using CPI data. This means that apparent consumption of wine estimates are indicative of the trends in consumption, but absolute values may not necessarily match amounts of wine sold. However, this method does produce estimates that closely match those produced by the Shipments of Wine and Brandy in Australia by Australian Winemakers and Importers series even after nine years of projection, as shown in Figure 2.
Figure 2: Comparison of apparent consumption of wine between the ABS series and estimates projected from 2004–05 to 2013–14.
Source: AIHW 2023.
Note that the total amount of WET paid is used in this collection, rather than the net amount of WET collected after rebates have been provided to winemakers. WET also covers both domestic and internationally produced wine available for sale in Australia.
It is assumed that all wine being sold (specifically the sale that involves payment of WET, usually a wholesale purchase) in a given in a financial year is consumed in that financial year. All products that attract WET are grouped into the category of wine for the purposes of this collection, apart from cider.
While some forms of cider do attract the Wine Equalisation Tax, these calculations account for that by subtracting a portion of the WET data based on the apparent consumption of cider proportions generated from the National Health Survey.
Subdividing total wine into wine categories
As a result of using WET to project total wine sales, volumes for individual wine categories cannot be estimated directly. Several methods were tested for breaking down the total wine volume into individual components. While total alcohol consumption estimates were similar regardless of the method used, individual volumes for white wine, red wine and other wines were found to change substantially depending on the method used.
It was observed that the proportions of wine categories according to the ABS survey series (combined with imported wines) remained stable over a 10-year period, varying only by one or two percentage points. As a result, the average proportions of red, white and other wines from the ABS survey series have been used to estimate the volumes of red wine, white wine and other wines from the projected total wine volume as projected using WET data.
This provides a consistent year-on-year trend of the amounts of red, white and other wines being consumed in Australia, allowing for long-term trends to be examined. However, it does not allow for observations of the relative consumption of different wine types over time.
The assumption of consistent relative consumption of different wine categories is likely to become less accurate over time. AIHW will continue to examine additional data sources to improve the data series for wine categories in future releases.
Calculating apparent consumption of alcohol from wine
Wine covers a range of beverages with a range of alcohol strengths. This publication uses a different average alcohol content for different types of wine, as shown in Table 2. The average alcohol content for red and white table wine was based on the results from testing wine that was exported from Australia and were sourced from Wine Australia (2022).
| Wine category | Average alcohol content |
|---|---|
White wine | 12.42% |
Red wine and rosé | 13.71% |
Sparkling and carbonated wines | 11.20% |
Fortified wine | 17.90% |
Note: Testing data is based on the year that the wine was exported. White wine uses a two-year rolling average and red wine and rosé uses a three year rolling average.
Source: AIHW 2023, Wine Australia 2023.
The wine category volumes created by subdividing total wine estimates were used in combination with the average alcohol strengths in Table 2 to estimate the total apparent consumption of alcohol from wine for each financial year.
Methodological changes
This publication represents a substantial change in the approach to calculating apparent consumption of wine. This method was chosen as it yields similar results to the previous long-term data series, Shipments of Wine and Brandy in Australia by Australian Winemakers and Importers, and the use of taxation data creates a methodological similarity to the calculation approaches for beer and spirits used in the collection.
Estimates largely match those previously published by the ABS through to 2013–14. The WET projection method has been applied from 2014–15 onwards, so results will not exactly match those previously published by the ABS. The similarity in estimates as seen in Figure 2 indicates that the estimation methods are consistent over time, however care should be taken when interpreting absolute values of apparent consumption of wine for all following years.
Apparent consumption of spirits
Data sources
The apparent consumption of alcohol considers spirits being made available from two sources:
- Domestically produced spirits that are intended to be sold in Australia.
- Internationally produced spirits that are imported into Australia.
Note that this excludes spirits that are imported into Australia only to be exported to another country.
Both of these sources use estimates from different data sources to calculate the total amount of spirits being made available to people living in Australia in each financial year.
No adjustments are made for the home-production of spirits, as these are assumed to make up a very small portion of the total spirits consumed in Australia.
Domestically produced spirits
All spirits that are produced with the intention of being sold in Australia attract an excise, according to the total volume of alcohol in the spirits. The Australian Taxation Office (ATO) is responsible for collecting this information and publishes excise data on data.gov.au.
Unlike beer, the entire volume of alcohol attracts excise. This means that no additional data sources are required, and the total volume of alcohol can be calculated directly from the total amount of excise paid.
Note that it is assumed that all spirits produced in a given financial year are made available in that financial year. Everything that attracts spirits-based excise is grouped into the spirits category, so other beverages that meet this excise definition (for example some seltzers) are defined as spirits for the purposes of the apparent consumption of alcohol collection.
Imported spirits
Spirits that are imported into Australia attract customs duty at the same rates as the excise duty on domestically produced spirits. The total imported volume of alcohol in various spirits categories is recorded by the Department of Home Affairs. For more information on specific import clearance items, see ABS (2018) appendix 6.2.
Note that it is assumed that all spirits imported into Australia in a given financial year are made available for consumption in that financial year. Everything that attracts spirits customs duties is grouped into the spirits category, so other beverages that meet this definition (for example some seltzers) are defined as spirits for the purposes of the apparent consumption of alcohol collection.
Spirits stored in bonded warehouses and subsequently exported are excluded from the collection. Spirits that are imported and used to produce new spirits-based beverages may pay domestic production excise instead of imported spirits excise and are excluded from imports data.
Methodological changes
No changes to the calculation methods for apparent consumption of spirits were made for this release of the apparent consumption of alcohol collection.
Apparent consumption of cider
Data sources
Cider is usually excised according to the Wine Equalisation Tax (WET), which is not related to the amount of alcohol in the beverage. Additionally, cider makes up a small fraction of the total WET amount, so it is not possible to use taxation data to estimate the amount of cider being consumed in Australia each year. This meant that cider was historically not included in the collection. However, as cider became a more popular beverage in Australia, it became important to estimate how much cider was being consumed in Australia.
The apparent consumption of alcohol collection uses self-reported responses from the National Health Survey to estimate how much cider was consumed by the respondents. As this is based on a sample, it does not provide an absolute value for cider consumed throughout Australia. Instead, it provides an amount of cider that was consumed compared to other alcoholic beverages in the surveyed population. This relative amount can be used in conjunction with the apparent consumption estimates for beer, wine and spirits to estimate the apparent consumption of alcohol from cider. In this way, the total amount of cider available for consumption is estimated from the amount of cider people reported drinking.
Using survey data means that cider estimates do not distinguish between the source of the cider. Cider estimates have been removed from other data sources such as import clearance estimates to avoid double-counting. Cider estimates are also prone to change, as cider proportions are only calculated in years where the National Health Survey are run. As cider is calculated relative to other beverage categories, changes to those estimates will also affect cider estimates.
This publication uses estimates from the 2017–18 National Health Survey to calculate apparent consumption of cider from 2017–18 to 2019–20. Typically, years where the National Health Survey is not run will use estimates interpolated between the prior and future survey waves. However, the 2020–21 National Health Survey is considered to be a break in the timeseries (ABS 2022), so the 2017–18 cider proportion will continue to be used until the next wave of National Health Survey results become available.
Methodological changes
No changes to the calculation methods for apparent consumption of spirits were made for this release of the apparent consumption of alcohol collection. Cider estimates may be different to the estimates previously published by the Australian Bureau of Statistics, due to changes in beer and wine estimates.
Population estimates
Per capita estimates in this publication use the National Australian population aged 15 and over, as defined by the OECD alcohol consumption indicator (OECD 2023).
Population estimates are used as of 31 December in the relevant financial year period and are sourced from the ABS (2022).