Like all Australians, people with disability have health-care needs, access health services to meet them, and have varying health-related experiences. This web report uses data from the Australian Bureau of Statistics’ (ABS) Survey of Disability, Ageing and Carers (SDAC) to examine access to a range of health services by people with disability aged under 65 who lived in the community.
The ABS Survey of Disability Ageing and Carers (SDAC)
In the SDAC, a person is considered to have disability if they have at least one of a list of limitations, restrictions or impairments, which has lasted, or is likely to last, for at least 6 months, and restricts everyday activities. The severity of disability is further defined according to the degree of assistance or supervision required in core activities—self-care, mobility, and communication—and grouped for mild, moderate, severe, and profound limitation. People with disability can also be identified as having a schooling or employment restriction.
The health experience data in the SDAC is collected from people with disability living in households (also referred to here as living in the community), and excludes those living in cared accommodation (such as residential aged care). Most people with disability living in cared accommodation had severe or profound core activity limitation, and most were older. Older people and those with more severe disability are more likely to require health-care. To minimise bias and to be consistent with national policy age ranges, this report focuses on the health experiences of people with disability aged under 65.
The coverage of the SDAC does not include people living in very remote areas and discrete Aboriginal and Torres Strait Islander communities and, as such, it may underestimate the prevalence of Indigenous disability and the prevalence of disability in very remote areas.
More information on the survey is available on the ABS website.
People with disability use a range of health services
People with disability use a range of mainstream health services—such as general practitioners (GP), medical specialists and dentists—and their care may require coordination between different health professionals. They may also rely on informal care, such as that provided by family and friends, to meet or supplement their health-care needs.
In 2015, of those aged under 65 living in the community:
|
|
most (93%) saw a GP |
|
|
1 in 5 (20%) saw a GP for urgent medical care |
|
|
2 in 3 (62%) saw a medical specialist |
|
|
half (50%) saw a dental professional |
|
|
1 in 4 (26%) visited a hospital emergency department (ED) |
|
|
1 in 5 (22%) had been admitted to hospital |
|
|
2 in 5 (37%) saw three or more different health professionals for the same condition |
|
|
1 in 4 (26%) had a health professional coordinating their care when they saw three or more different health professionals for the same condition |
|
|
2 in 3 (63%) who needed help with health-care activities received informal services(a) |
|
|
2 in 5 (44%) who needed help with health-care activities received formal services(a) |


- Aged 5–64.
Source: AIHW analysis of ABS 2015 SDAC confidentialised unit record file; tables S1 and S7.
The patient experience information collected in the SDAC does not include health professionals other than GPs, medical specialists and dental professionals. Hence, it is not possible to examine from this survey whether some needs for non-hospital health services were met by other health professionals, such as nurses, pharmacists or other allied health professionals.
As the patient experience information in the SDAC is only collected from persons with disability and their carers, it is not possible for comparisons to be made with the overall population of those without disability. While not directly comparable, information from the ABS’ Patient Experience Survey 2015–16, which looked at the use of health services by the general Australian population, suggests that people with disability are more likely to face barriers such as cost when accessing some types of health services. For example, people with disability aged 15–64 identified in the SDAC were slightly more likely than the general Australian population aged 15–64 identified in the Patient Experience Survey to delay seeing or not see a GP or dental professional when they needed to because of the cost—20% compared with 16%, and 65% compared with 61%.
Some people with disability experience difficulties accessing health services
Service accessibility is dependent on many factors. Some people with disability experience difficulties in accessing health services, such as unacceptable or lengthy waiting times, cost, inaccessibility of buildings and discrimination by health professionals. They may also experience issues caused by lack of communication between different health professionals treating them.
In 2015, among people with a disability aged under 65 living in the community:
|
|
1 in 5 (22%) who saw a GP waited longer than they felt was acceptable to get the appointment |
|
|
1 in 4 (24%) waited 1 or more days after making an appointment to see a GP for urgent medical care |
|
|
1 in 5 (19%) delayed or did not see a GP because of the cost |
|
|
1 in 3 (30%) who saw a medical specialist waited longer than they felt was acceptable to get the appointment |
|
|
1 in 4 (27%) did not see a medical specialist when they needed to, mainly because of the cost |
|
|
1 in 8 (12%) had been placed on a waiting list for an appointment at a public dental clinic |
|
|
nearly half (45%) of those on a public dental waiting list waited 1 month to 1 year before receiving dental care |
|
|
1 in 3 (35%) of those on a public dental waiting list were still waiting for dental care at a public dental clinic |
|
|
2 in 3 (64%) delayed seeing or did not see a dental professional because of the cost |
|
|
1 in 4 (24%) delayed going or did not go to hospital because of the cost |
|
|
1 in 8 (13%) felt a GP could have provided care for their most recent visit to a hospital emergency department |
|
|
1 in 6 (17%) who saw three or more different health professionals for the same health condition reported there were issues caused by lack of communication among different health professionals |
|
|
1 in 6 (17%) who had experienced discrimination in the last 12 months reported the source of that discrimination as health staff (GP, nurse, hospital staff)(a) |
|
|
2 in 5 (38%) who had difficulty accessing buildings or facilities in the last 12 months had difficulty accessing medical facilities (GP, dentist, hospital)(b) |
|
|
1 in 8 (13%) who needed help with health-care activities had no source of assistance (either formal or informal)(b) |
|
|
1 in 6 (17%) who needed help with health-care activities had their need for health-care assistance only partly met or not met at all(b) |


- Aged 15–64.
-
Aged 5–64. The reported reasons for people who needed but did not receive assistance from formal services for their health-care activities included ‘do not know of service’, ‘service costs too much’, ‘not eligible for service’ and ‘no services available’, among other reasons.
Source: AIHW analysis of ABS 2015 SDAC confidentialised unit record file; tables S1, S5, S7, S10 and S12.
As the patient experience information in the SDAC is only collected from persons with disability and their carers, it is not possible for comparisons to be made with the overall population of those without disability. While not directly comparable, information from the ABS’ Patient Experience Survey 2015–16, which looked at the use of health services by the general Australian population, suggests that people with disability are more likely to face barriers such as cost when accessing some types of health services. In particular, people with disability aged 15–64 identified in the SDAC were nearly three times as likely as the general Australian population aged 15–64 identified in the Patient Experience Survey to delay seeing or not see a medical specialist when they need to because of the cost—27% compared with 11%. They were slightly more likely to delay seeing or not see a GP or dental professional when they needed to because of the cost—20% compared with 16%, and 65% compared with 61%.
Where a person lives makes a difference…
The use of health services in areas outside of major cities may be affected by various factors, for example by increased distance to service providers, fewer services being available, and lower socioeconomic status in some areas.
People with disability aged under 65 living in the community in Outer regional and Remote areas were less likely than those living in Major cities to see a GP, medical specialist, or dentist.
Figure 1: Use of selected health services(a), by remoteness, 2015
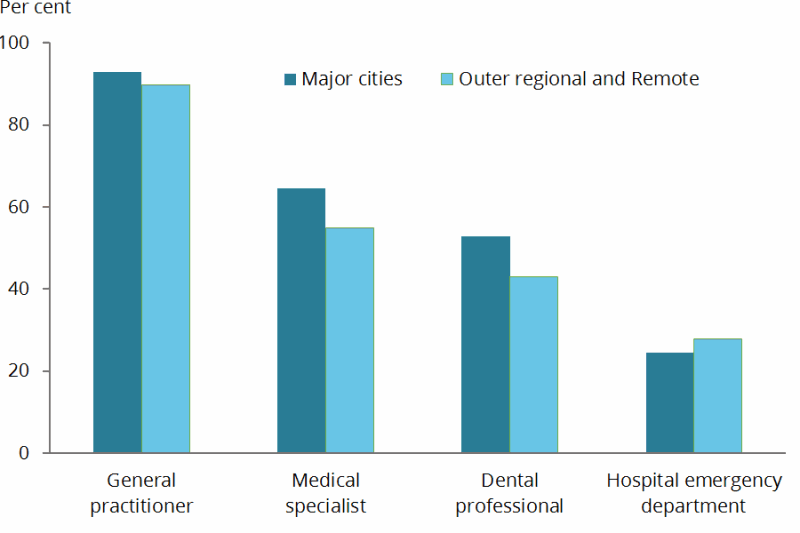
- People with disability aged under 65 living in households.
Source: AIHW analysis of ABS 2015 SDAC confidentialised unit record file; Table S2.
People with disability aged under 65 living in the community in Outer regional and Remote areas were more likely than those living in Major cities to:
|
|
|
Outer regional and Remote |
Major cities |
|
|
visit a hospital emergency department for care they felt could be provided by a GP |
16% |
10% |
|
|
indicate that the time of day or the day of week was the main reason they went to a hospital emergency department instead of a GP on the most recent occasion |
25% |
17% |
|
|
wait longer than they felt acceptable for an appointment with a GP |
30% |
20% |
|
|
wait longer to see a GP for urgent medical care (more than 1 day) |
28% |
22% |
|
|
face difficulties caused by a lack of communication among different types of health professionals in the coordination of their care(a) |
20% |
16% |
|
|
receive only informal assistance for health-care activities(b) |
53% |
42% |
|
|
have difficulty accessing medical facilities (GP, dentist, hospital)(c) |
44% |
37% |


- Proportion of those who saw three or more different health professionals for the same health condition.
- Proportion of those aged 5–64 who needed help with health-care activities.
- Proportion of those aged 5–64 who had difficulty accessing buildings or facilities in the last 12 months.
Source: AIHW analysis of ABS 2015 SDAC confidentialised unit record file; tables S2, S5, S8 and S11.
The higher rate of use of hospital emergency departments for non-hospital services in outer regional and remote areas partly occurs within a broader context of the supply of health services in terms of type, volume and geographical distribution. Data from the Medical Workforce Survey indicates that the supply of employed medical practitioners, especially non-GPs, decreases with remoteness, with most tending to be concentrated in urban areas (AIHW 2016a; AIHW 2016b).
Other factors to consider in understanding these differences include a higher proportion of people with disability living in Outer regional and Remote areas noting in the SDAC that:
- the time of day or day of week was the main reason they went to a hospital emergency department instead of a GP
- the main reason their need for formal health-care assistance remained unmet was because they ‘did not know of service’, were ‘unable to arrange service’ or there were ‘no services available’.
This suggests that some people with disability in these areas may use a hospital ED as their point of contact with the health system because of unavailability of other health services or a lack of communication or understanding about what services are available.
Figure 2: Main reason has unmet need for formal health-care assistance(a), by remoteness, 2015
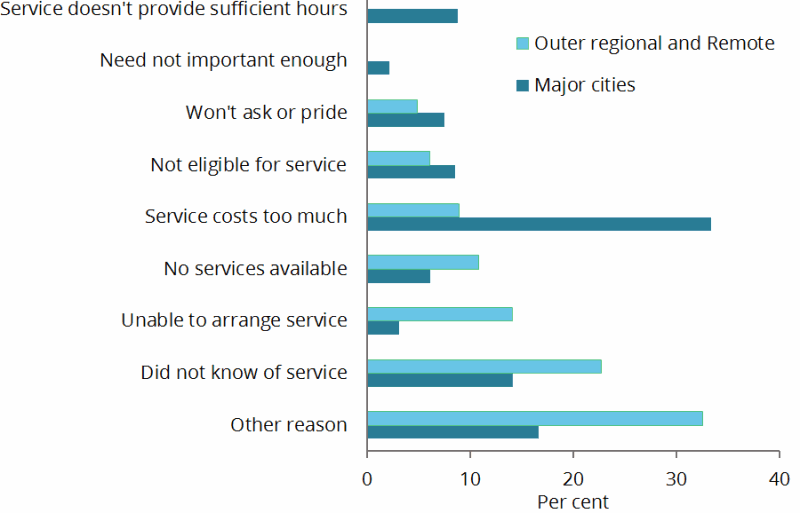
- People with disability aged 5–64 living in households who needed more formal assistance.
Source: AIHW analysis of ABS 2015 SDAC confidentialised unit record file.
…As does their severity of disability
People aged under 65 with severe or profound core activity limitation (that is, who sometimes or always need help with activities of self-care, mobility or communication) who lived in the community were more likely than those with disability but without this level of limitation to use a range of health services, particularly medical specialists. They were also more likely to see three or more health professionals for the same condition, have a health professional coordinating their care, and face difficulties caused by a lack of communication among different health professionals.
Those without severe or profound core activity limitation were slightly more likely than those with severe or profound limitation to report cost as a factor in why they delayed seeing or didn't see a medical specialist, dental professional or hospital.
Figure 3: Use of health selected services(a), by broad level of activity limitation, 2015
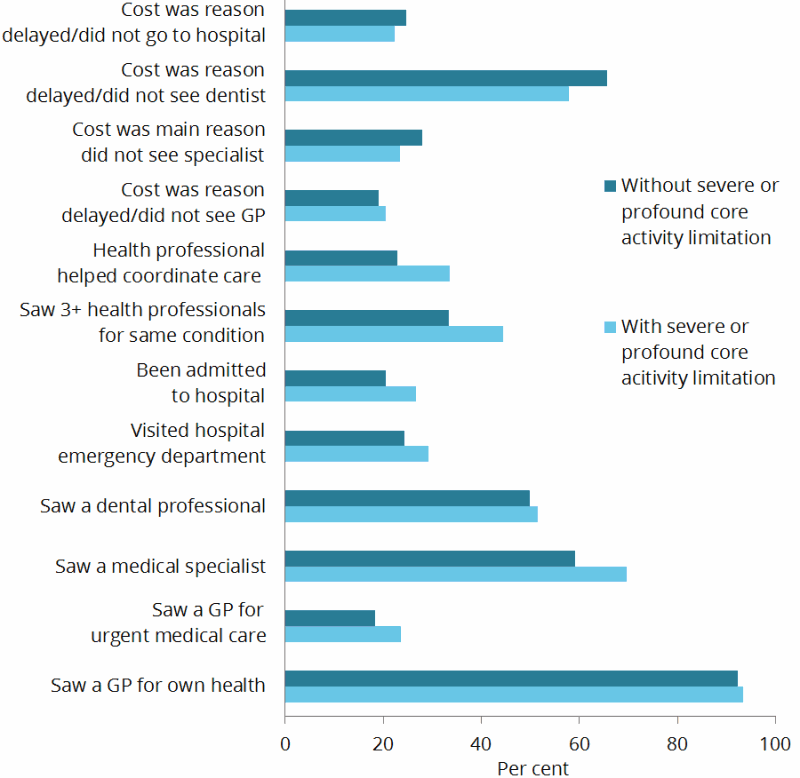
- People with disability aged under 65 living in households.
Source: AIHW analysis of ABS 2015 SDAC confidentialised unit record file; Table S2.
What’s missing from the picture?
Disability prevalence data from surveys such as the ABS SDAC provide important information on various issues relevant to the use of health services by people with disability, but it is only part of the picture. Information from other sources is needed to complement it, and to present a more complete picture of the experiences of people with disability as they take part in various aspects of life in Australia, including engaging in the health system.
One key data gap relates to the availability of administrative data on the use of mainstream health services by people with disability. At present, many health-related data collections—such as those on hospitals, the Medicare Benefits Schedule (MBS) and the Pharmaceutical Benefits Scheme (PBS)—do not include a way to identify if a person has disability. They also do not include consistent linkage information to enable easy joining of separate sources of data. This limits the ability to report comprehensively on the use of specific health services and to examine the interactions between health and other service sectors.
Improving the information and data available about people with disability has multiple uses and benefits, with stronger evidence leading to better decisions and, ultimately, to improved health and welfare for people with disability.
References
AIHW (Australian Institute of Health and Welfare) 2016a. Medical practitioners workforce 2015. Viewed 13 November 2017.
AIHW 2016b. Australia’s health 2016. Australia’s health series no. 15. Cat. no. AUS 199. Canberra: AIHW.
ABS (Australian Bureau of Statistics) 2016. Microdata: National Health Survey, 2014–15, TableBuilder. ABS cat. no. 4324.0.55.001. Canberra: ABS. Findings based on use of ABS TableBuilder data.