SAB in public hospitals
Scope of public hospital SAB data in this report
Data in this report relating to numbers of cases and rates of S. aureus bloodstream infections exclude public hospitals where there were no SAB surveillance arrangements, as well as some public hospital services supplied by private hospitals. Data relating to individual public hospitals with SAB surveillance arrangements where services are supplied by private providers are available from the MyHospitals website.
In 2017–18:
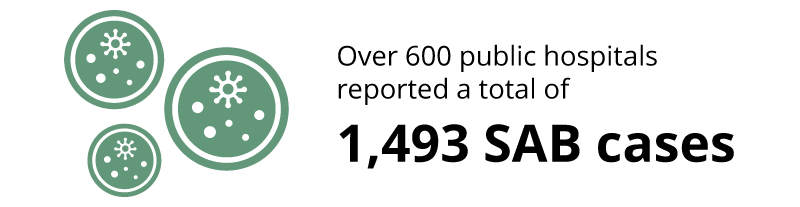
- There were 1,493 cases of SAB occurring during 20.5 million days of patient care under surveillance. Patient days under SAB surveillance covered 98% of days of patient care in public hospitals.
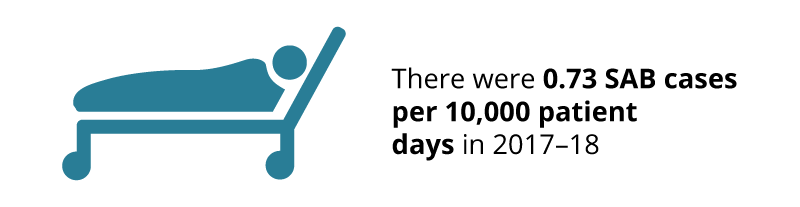
- Overall, there were 0.73 SAB cases per 10,000 patient days.
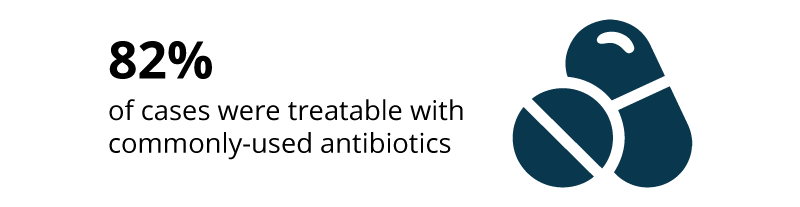
- 82% of SAB cases were methicillin-sensitive (MSSA), and therefore treatable with commonly used antimicrobials.
Changes in SAB rates over time
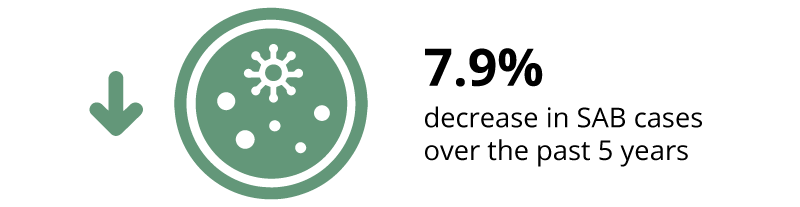
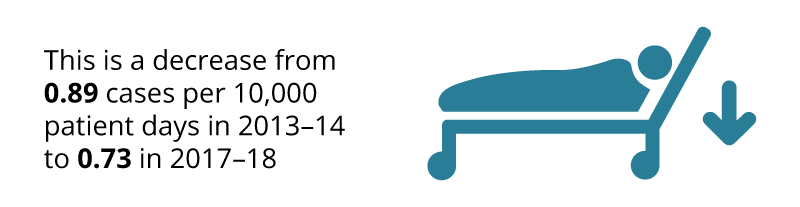
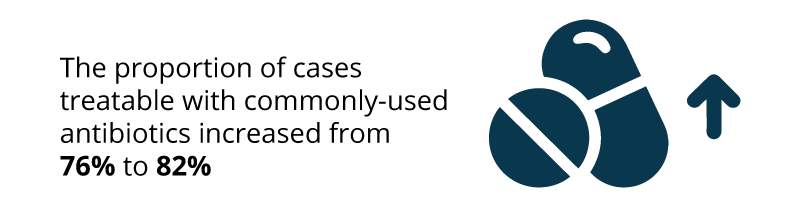
Figure PB1 and Table PB1 show changes in SAB rates between 2013–14 and 2017–18.
Figure PB1. SAB in public hospitals, MRSA, MSSA and total SAB rates, 2013–14 to 2017–18
SAB in private hospitals
Currently, private hospitals participate in the NSABDC on a voluntary basis, and coverage of SAB cases and rates in the private sector is therefore incomplete. Data reported by participating private hospitals may not be representative of the private sector as a whole. The case mix of patients treated in private hospitals may also be different to that in public hospitals.
The rate of private hospital participation in the NSABDC for 2017–18 is calculated using counts of all private hospitals from the 2016–17 Private Health Establishments Collection of the Australian Bureau of Statistics (ABS 2018).
In 2017–18:
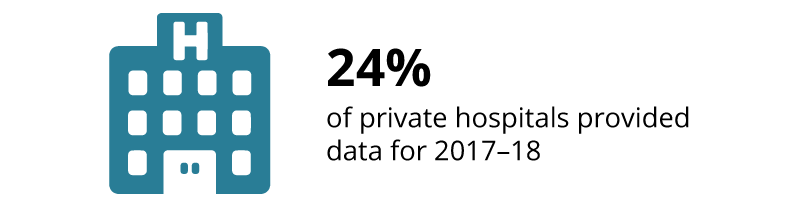
- As shown in Table PV1, about one in four private hospitals (160, or 24%)1 participated in the NSABDC. This is similar to overall participation figures for the 2016–17 NSABDC (89 private hospitals having provided data by the time of the previous AIHW report, with around 60 more submitting data in the following months for inclusion on the MyHospitals website).
- Private hospitals participating in the 2017–18 NSABDC included 3 that also provided public hospital services. These are shown as public hospitals on MyHospitals.
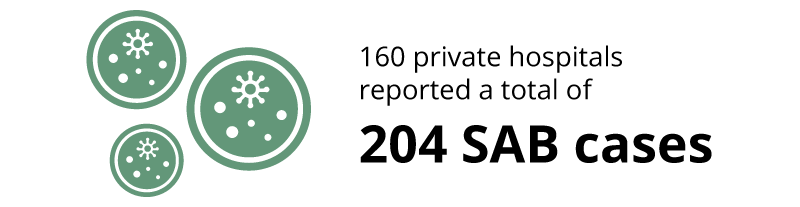
- A total of 204 cases of SAB were reported by private hospitals.
- All private hospitals reporting SAB data had rates below the national benchmark1.
- The total SAB rate for all private hospitals participating in the 2017–18 NSABDC was 0.33 cases per 10,000 patient days. Note the SAB rates in private hospitals choosing to participate in the collection might not be representative of private hospitals as a whole and therefore are not readily comparable to public hospitals.
- Amongst the 65 private hospitals that reported 1 or more SAB cases in 2017–18, SAB rates ranged from 0.11 cases per 10,000 patient days to 1.84 cases per 10,000 patient days1.
- 30 of the private hospitals reporting 1 more SAB cases provided separate counts of MSSA and MRSA cases. Among these hospitals, rates of MSSA ranged from 0 to 1.84 and rates of MRSA ranged from 0 to 0.411.
Counts and rates for individual private hospitals participating in the NSABDC are provided on MyHospitals.
Notes
1. Includes 4 private hospitals that provided SAB rates but did not provide counts of SAB cases or patient days.
|
|
Private hospitals participating in 2017–18 NSABDC (a) no. |
Private hospitals listed as such in 2016–17 no. |
Participation rate % |
|---|---|---|---|
|
NSW |
48 |
210 |
23 |
|
Vic |
52 |
174 |
29 |
|
Qld |
29 |
118 |
25 |
|
WA |
15 |
64 |
23 |
|
SA |
12 |
56 |
21 |
|
Tas, ACT & NT (b) |
4 |
35 |
11 |
|
Total |
160 |
657 |
24 |
- Includes some public hospital services supplied by private providers.
- Figures for Tasmania, the Australian Capital Territory and the Northern Territory were combined to protect the confidentiality of the small numbers of private hospitals in these jurisdictions.
Source: AIHW National Staphylococcus aureus Bacteraemia Data Collection and ABS Private Health Establishments Collection (ABS 2018).
References
- Australian Bureau of Statistics (ABS) 2018. Private Hospitals, Australia, 2016–17, ABS cat. no. 4390.0. Canberra: ABS. Viewed 6 November 2018.
- Australian Commission on Safety and Quality in Health Care (ACSQHC) and National Health Performance Authority (NHPA) 2015. Australian Atlas of Healthcare Variation. Sydney: ACSQHC. Viewed 15 November 2018.
- Australian Commission on Safety and Quality in Health Care (ACSQHC) and Australian Institute of Health and Welfare (AIHW), 2018. Australian Atlas of Healthcare Variation. Sydney: ACSQHC. Viewed 13 December 2018.
- Australian Institute of Health and Welfare (AIHW) 2015. Australian hospital peer groups. Health services series no. 66. Cat no. HSE 171. Canberra: AIHW. Viewed 12 November 2018.