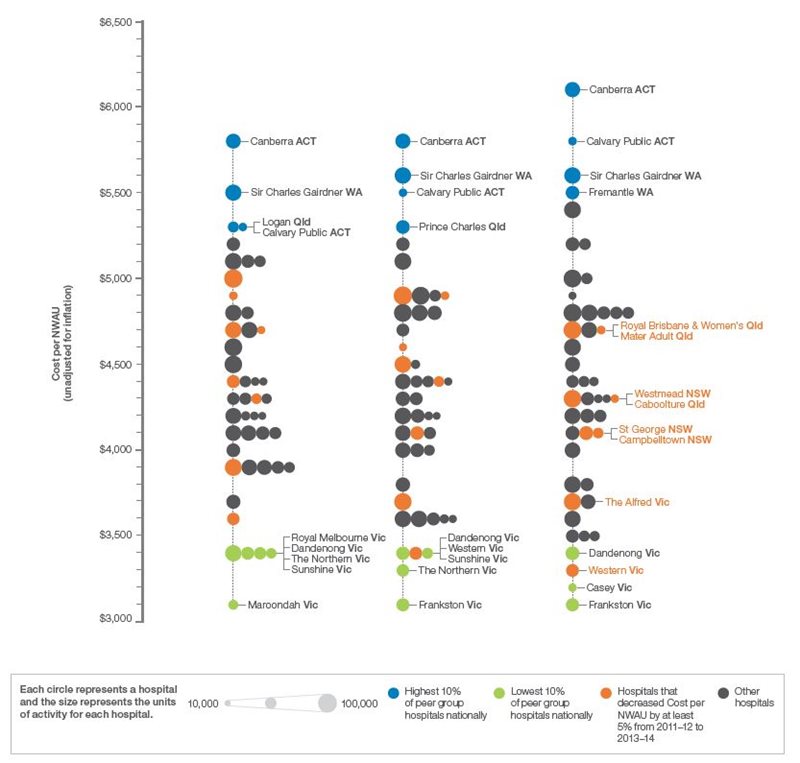
Cost per NWAU, 2013–14
In 2013–14, some major metropolitan public hospitals were found to cost almost twice as much as similar hospitals in the average cost of care, as measured by Cost per NWAU.
Across major metropolitan public hospitals, the average Cost per NWAU was $4,420. The averages at individual major metropolitan public hospitals ranged from $3,100 at one hospital to $6,100 at another hospital (97% higher) (Figure 1).
In 2013–14, the lowest 10% and highest 10% of major metropolitan public hospitals are presented below.
| Highest 10% | |
|---|---|
| The Canberra Hospital (ACT) | $6,100 |
| Calvary Public Hospital (ACT) | $5,800 |
| Sir Charles Gairdner Hospital (WA) | $5,600 |
| Fremantle Hospital (WA) | $5,500 |
| Lowest 10% | |
|---|---|
| Dandenong Campus (Vic) | $3,400 |
| Western Hospital [Footscray] (Vic) | $3,300 |
| Casey Hospital (Vic) | $3,200 |
| Frankston Hospital (Vic) | $3,100 |
The Authority has also updated the website with data for more than 100 public hospitals.
Across large metropolitan public hospitals, the average cost per NWAU was $4,590. The averages at individual large metropolitan public hospitals ranged from $3,600 at one hospital to $5,800 at another hospital (61% higher).
| Highest 10% | |
|---|---|
| Armadale-Kelmscott Memorial Hospital (WA) | $5,800 |
| Lowest 10% | |
|---|---|
| Werribee Mercy Hospital (Vic) | $3,600 |
Across major regional public hospitals, the average cost per NWAU was $4,470. The averages at individual major regional public hospitals ranged from $3,400 at one hospital to $5,400 at another hospital (59% higher).
| Highest 10% | |
|---|---|
| Mackay Base Hospital (Qld) | $5,400 |
| Royal Darwin Hospital (NT) | $5,300 |
| Lowest 10% | |
|---|---|
| Goulburn Valley Health [Shepparton] (Vic) | $3,900 |
| Port Macquarie Hospital (NSW) | $3,900 |
| Latrobe Regional Hospital (Traralgon) (Vic) | $3,400 |
Across large regional public hospitals, the average cost per NWAU was $4,630. The averages at individual large regional public hospitals ranged from $3,200 at one hospital to $5,900 at another hospital (84% higher).
| Highest 10% | |
|---|---|
| Bathurst Hospital (NSW) | $5,900 |
| Lowest 10% | |
|---|---|
| Wimmera Base Hospital (Vic) | $3,200 |
| 2011–12 | 2012–13 | 2013–14 | |
|---|---|---|---|
| Peer average expenditure per hospital | $214,775,000 | $222,300,900 | $228,444,200 |
| Peer average NWAU per hospital |
48,987 |
50,917 | 51,668 |
| Peer average Cost per NWAU | $4,380 | $4,370 | $4,420 |
Note: References can be found in the Technical Supplement and definitions of terms in the Glossary.
Sources: National Health Performance Authority analysis of results calculated using the National Hospital Cost Data Collection, the Admitted Patient Care National Minimum Data Set and the Hospital Casemix Protocol Data Collection. Data supplied 18 and 28 October 2014 (2011–12 data) and 27 November 2015 (2012–13 and 2013–14 data).