Number and rate of allied ophthalmic personnel
There are 4 separate charts for this measure showing the number and rate of full-time equivalent (FTE) allied ophthalmic personnel per 100,000 population, by various characteristics.
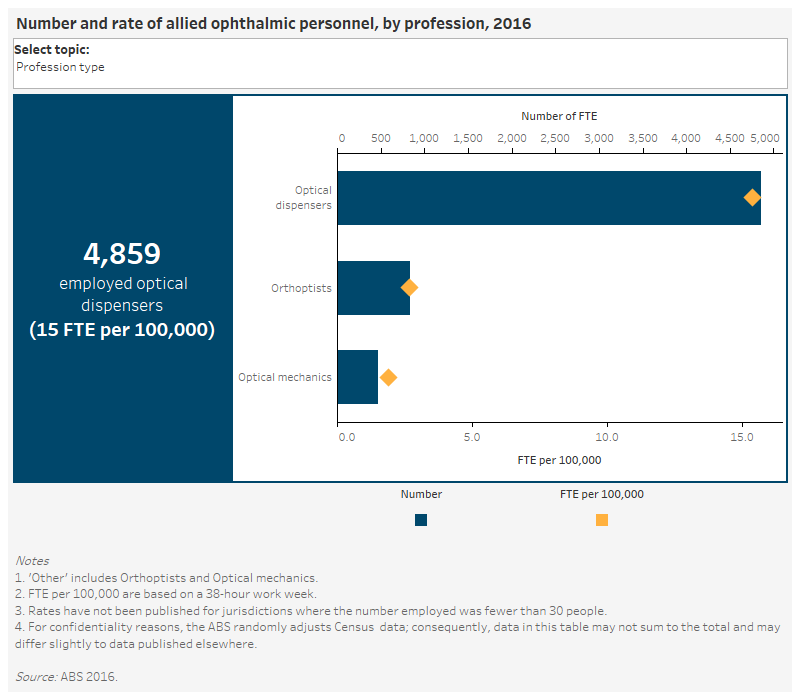
Number and rate of allied ophthalmic personnel, by profession, 2016
This dual axis horizontal bar chart and scatter plot presents the number and FTE rate of allied ophthalmic personnel in 2016, by profession. The chart shows that the biggest category of allied ophthalmic personnel in Australia was optical dispensers. In 2016, there were around 4,855 optical dispensers (15.4 FTE per 100,000), 834 orthoptists (2.7 FTE per 100,000) and 472 optical mechanics (1.9 FTE per 100,000) in Australia.
Number and rate of allied ophthalmic personnel, by profession and region, 2016
This dual axis combined grouped vertical bar chart and scatter plot presents the number and FTE rate of optical dispensers and ‘other’ allied ophthalmic personnel in 2016, by remoteness. The chart shows that Major cities had the highest number (3,609) and rate (16 FTE per 100,000) of optical dispensers and other allied ophthalmic personnel (1,134, or 5.6 FTE per 100,000). This was followed by Inner regional areas with 919 optical dispensers (17 FTE per 100,000) and 138 other allied ophthalmic personnel (2.5 FTE per 100,000). There were insufficient numbers of optical dispensers and other allied ophthalmic personnel in Remote and Very remote areas to calculate rates.
Number and rate of allied ophthalmic personnel, by profession and jurisdiction, 2016
This dual axis combined grouped vertical bar chart and scatter plot presents the number and FTE rate of optical dispensers and ‘other’ allied ophthalmic personnel in 2016, by state and territory. The chart shows that New South Wales had the highest number (1,469) and rate (15 FTE per 100,000) of optical dispensers and other allied ophthalmic personnel (512 or 5.6 FTE per 100,000). This was followed by Victoria with 1,118 (14 FTE per 100,000) optical dispensers and 485 other allied ophthalmic personnel (6.5 FTE per 100,000).
Number and rate of allied ophthalmic personnel, 2010 and 2016
This dual axis combined grouped vertical bar chart and scatter plot presents the number and FTE rate of optical dispensers and ‘other’ allied ophthalmic personnel in 2010 and 2016. In 2010 there were 4,239 optical dispensers (19.0 FTE per 100,000), and in 2016 that number was 4,859 (15.4 FTE per 100,000).