Life expectancy
Life expectancy is the most commonly used measure to describe population health and reflects the overall mortality level of a population. Life expectancy measures how long, on average, a person is expected to live based on current age and sex-specific death rates. In summarising mortality patterns, life expectancy is often expressed as the number of years of life, from birth, a person is expected to live.
Trends in life expectancy
Life expectancy in Australia has improved dramatically for both sexes in the last century, particularly life expectancy at birth. Compared with their counterparts in 1891–1900, boys and girls born in 2019–2021 can expect to live around 30 years longer (Figure 8.1).
Figure 8.1: Life expectancy (years) at birth in Australia, by sex, 1891–1900 to 2019–2021
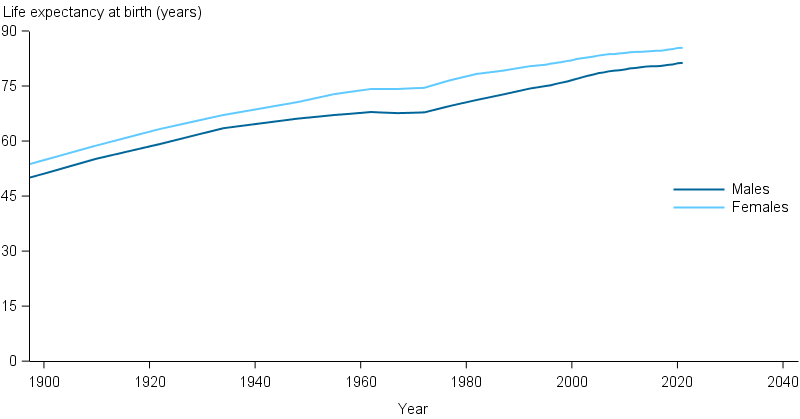
Sources: ABS 2014a; ABS 2014b; ABS 2015; ABS 2016; ABS 2017; ABS 2018a; ABS 2019; ABS 2020; ABS 2021; ABS 2022; Table S8.1.
In Australia, a boy born in 2019–2021 can expect to live to the age of 81.3 years and a girl would be expected to live to 85.4 years compared to 51.1 for boys and 54.8 years for girls born in in 1891–1900.
Life expectancy changes over the course of a person’s life because as they survive the periods of birth, childhood and adolescence, their chance of reaching older age increases. The life expectancy at different ages can be presented as the number of additional years a person can expect to live or their expected age at death in years.
Men aged 65 in 2019–2021 could expect to live another 20.3 years (an expected age at death of 85.3 years), and women aged 65 in 2019–2021 could expect to live another 23.0 years (an expected age at death of 88.0 years) (Table 8.1).
| Age (years) | Males 1891–1900 | Males 1960–1962 | Males 2019–2021 | Females 1891–1900 | Females 1960–1962 | Females 2019–2021 |
|---|---|---|---|---|---|---|
| 0 (birth) | 51.1 | 67.9 | 81.3 | 54.8 | 74.2 | 85.4 |
| 1 | 57.9 | 69.5 | 81.6 | 60.9 | 75.5 | 85.7 |
| 15 | 62.0 | 70.1 | 81.7 | 65.0 | 76.0 | 85.8 |
| 25 | 63.9 | 70.8 | 82.0 | 66.7 | 76.3 | 85.9 |
| 45 | 69.0 | 72.4 | 82.9 | 71.7 | 77.4 | 86.4 |
| 65 | 76.3 | 77.5 | 85.3 | 77.8 | 80.7 | 88.0 |
| 85 | 88.8 | 89.1 | 91.6 | 89.1 | 89.8 | 92.7 |
| 95 | 97.2 | 97.3 | 98.1 | 97.2 | 97.6 | 98.4 |
Sources: ABS 2014a; ABS 2022; Table S8.1.
Life expectancy of Aboriginal and Torres Strait Islander people
For the Aboriginal and Torres Strait Islander population born in 2015–2017, males can expect to live to the age of 71.6 years and females to the age of 75.6 years. This is 8.6 years lower than that of non-Indigenous males and 7.8 years lower for non-Indigenous females born in 2015–2017.
Between 2005–2007 and 2015–2017, Indigenous life expectancy at birth for boys increased by 4.4 years and by 2.7 years for girls. Over the same period, the difference between Indigenous and non-Indigenous life expectancy narrowed by 2.9 years for males and 1.9 years for females.
As shown in Table 8.2, this has resulted in a small decline in the life expectancy difference between Indigenous and non-Indigenous Australians.
| Indigenous status | Males 2005–2007 | Males 2010–2012 | Males 2015–2017 | Females 2005–2007 | Females 2010–2012 | Females 2015–2017 |
|---|---|---|---|---|---|---|
| Indigenous | 67.2 | 69.1 | 71.6 | 72.9 | 73.7 | 75.6 |
| Non-Indigenous | 78.7 | 79.7 | 80.2 | 82.6 | 83.1 | 83.4 |
| Difference | 11.5 | 10.6 | 8.6 | 9.7 | 9.5 | 7.8 |
Sources: ABS 2009; ABS 2013; ABS 2018b.
International comparisons of life expectancy
Australia enjoys one of the highest life expectancies in the world, at 83.2 years in 2021 for males and females at birth combined – ranked fifth among 38 member countries of the Organisation for Economic Co-operation and Development (OECD). The country with the highest life expectancy at birth for males was Switzerland (81.9 years), and for females was Japan (87.7 years) (Table 8.3).
Rank | Country | Males | Country | Females | Country | Persons |
|---|---|---|---|---|---|---|
1 | Switzerland | 81.9 | Japan | 87.7 | Japan | 84.7 |
2 | Iceland | 81.8 | Korea | 86.5 | Switzerland | 84.0 |
3 | Norway | 81.7 | Spain | 86.2 | Korea | 83.5 |
4 | Japan | 81.6 | Switzerland | 85.9 | Spain | 83.3 |
5 | Sweden | 81.4 | France | 85.5 | Australia | 83.2 |
6 | Australia | 81.2 | Australia | 85.3 | Iceland | 83.2 |
7 | Ireland | 80.8 | Italy | 85.1 | Norway | 83.2 |
8 | Luxembourg | 80.7 | Sweden | 85.0 | Sweden | 83.2 |
9 | Italy | 80.6 | Luxembourg | 84.9 | Italy | 82.9 |
10 | Israel | 80.5 | Finland | 84.7 | Luxembourg | 82.8 |
| 10 | Korea | 80.5 | Norway | 84.7 | ||
| 10 | New Zealand | 80.5 |
Source: OECD 2023; Table S8.2.
Calculating life expectancy
Life expectancy is calculated using a statistical tool called a life table. A life table is generated from current age- and sex-specific death rates in a given population. The resulting values are used to estimate the likelihood of someone in a hypothetical population dying before their next birthday.
Calculating a person’s life expectancy is based on death patterns in the population and assumes that current death rates will persist throughout that person’s life.
The Australian Bureau of Statistics (ABS) publishes life tables and calculates life expectancy for the Australian population and for some groups of the population (ABS 2022). These measures are based on 3 years of data to reduce the effect of variations in death rates from year to year.
Life expectancy is related to the average age at death within a population and is inversely related to the population death rates at that time; that is, the lower the death rates the greater the life expectancy. It varies between population groups and over time. High life expectancy is often associated with low infant and child death rates, an ageing population and access to high quality health care.
Differences in life expectancy over time may be due to changes in the patterns of death due to certain conditions. For example, in 1922, infectious disease accounted for 15% of all deaths in Australia and on average people dying from these diseases were 27 years old. By comparison, in 2021, infectious diseases accounted for less than 2% of deaths and the average age at death for these diseases was 80 years. For more information on this and other causes, see the General Record of Incidence in Mortality (GRIM) books.
Health-adjusted life expectancy
Burden of disease measures include a measure of health-adjusted life expectancy (HALE) which extends the concept of life expectancy by considering the time spent living with the health consequences of disease and injury. HALE reflects the average number of years of life expected in full health. The ratio of HALE to life expectancy, expressed as a percentage, represents the proportion of life expectancy that is spent in full health. The most recent estimates of HALE for Australians are for 2022. For males born in 2022, HALE was 71.6 years and for females it was 74.1 years. This equates to males and females, on average, living 88% and 87% of their lives in full health, respectively.
For more information, see Australian Burden of Disease Study 2022.