Results
During the period 1997 to 2007, there were 1,442,303 deaths (Table 1). In each year, typically 93% of all deaths were due to a specified natural underlying cause. In 2007, of the remainder, 6% were due to an external underlying cause and less than 1% to ill-defined underlying causes. The results in this bulletin are based on the 1,342,378 deaths where the underlying cause was a specified natural cause.
For each of the deaths due to natural causes, other causes often contribute to the death. The total number of causes contributing to deaths (the underlying and the associated causes) during the period 1997 to 2007 is presented in Table 1 as multiple causes. The average number of conditions reported on death certificates has increased slightly over time, from 2.7 conditions in 1997 to 3.1 in 2007 (Table 1).
| Year | Among deaths due to natural causes(a) - Number by underlying cause | Among deaths due to natural causes(a) - Number by multiple causes(b) | Among deaths due to natural causes(a) - Average number of causes | Deaths due to all causes - Number | Deaths due to all causes - Per cent natural |
|---|---|---|---|---|---|
| 1997 | 120,650 | 330,764 | 2.7 | 129,350 | 93.3 |
| 1998 | 118,012 | 327,517 | 2.8 | 127,202 | 92.8 |
| 1999 | 118,730 | 330,958 | 2.8 | 128,102 | 92.7 |
| 2000 | 119,370 | 331,864 | 2.8 | 128,291 | 93.0 |
| 2001 | 120,062 | 337,102 | 2.8 | 128,544 | 93.4 |
| 2002 | 125,070 | 356,136 | 2.8 | 133,707 | 93.5 |
| 2003 | 123,568 | 372,303 | 3.0 | 132,292 | 93.4 |
| 2004 | 123,449 | 377,021 | 3.1 | 132,508 | 93.2 |
| 2005 | 121,618 | 376,345 | 3.1 | 130,714 | 93.0 |
| 2006 | 124,287 | 396,232 | 3.2 | 133,739 | 92.9 |
| 2007 | 127,562 | 401,628 | 3.1 | 137,854 | 92.5 |
| Total 1997-2007 | 1,342,378 | 3,937,870 | 2.9 | 1,442,303 | 93.1 |
- In this bulletin, natural causes of death do not include deaths where the underlying cause of death was coded to an external cause or an ill-defined cause. See Appendix for a list of ill-defined causes excluded from these analyses.
- Number of multiple causes of death reported in this table refers to mentions of all diseases contributing to each death.
Note: Deaths data for 2006 and 2007 are preliminary data and are subject to revision.
Source: AIHW analysis of AIHW National Mortality Database.
In 2007, 20% of deaths were due to a single natural cause; for 21% of deaths, five or more causes contributed to the death. Over the period 1997 to 2007, the proportion of deaths caused by a single disease has remained steady, hovering between 19% and 22% (Figure 1). The proportion of deaths resulting from multiple diseases shows some variation over time. Specifically, over the period 1997 to 2007, there was:
- a decline in the proportion of deaths having two causes, from 27.2% to 20.8%
- a decline in the proportion of deaths having three causes, from 24.9% to 21.6%
- an increase in the proportion of deaths reporting four causes, from 14.8% to 16.5%
- an increase in the proportion of deaths having five or more causes, from 11.4% to 20.7%.
Variation in patterns of cause of death (using either underlying or multiple cause data), including the average number of causes contributing to deaths, can be influenced by changes to the coding processes, changes in certification practices, and actual changes in the population of the diseases that cause death. It can be difficult to untangle these sources of variation without looking at the types of diseases that caused death and other factors associated with dying, including age at death. These aspects of multiple causes of death are described below.
Figure 1: Trends in the number of diseases contributing to deaths where the underlying cause was coded to a natural cause of death, 1997 to 2007
Note: Data for 2006 and 2007 are preliminary data and are subject to revision.
Source: AIHW analysis of AIHW National Mortality Database.
Variation in multiple causes of death by age at death
The average number of diseases causing death varies by age. Trends over time and by age at death for the average number of diseases causing death are shown in Figure 2.
For deaths among 30-59 year olds, on average, fewer conditions contributed to death compared with deaths among 60-89 year olds. Within the latter age group, the average number of causes increased with increasing age. For deaths among the very old (95 years or more) the average number of diseases contributing to death was lower than among those aged 75-94. Different researchers have attributed this result to different reasons, such as living to much older ages being associated with having better health and therefore fewer illnesses influencing death (Desequelles et al. 2010), or that less attention is given to documenting the causes of death among the very elderly (Gorina & Lentzner 2008). In the younger age groups (up to 29) there is considerable variation in the average number of causes reported for each death.
The variation over time in the average number of causes contributing to deaths among younger people is likely influenced by the smaller number of deaths that occur in these age groups as well as the types of conditions causing death among younger people. Natural deaths at these ages tend to be mainly due to perinatal conditions and congenital conditions (among under 1 year olds) and cancer in the other age groups. Among 25-64 year olds, cancers feature among the leading causes of death (AIHW 2010). Among people aged 65 or more, cardiovascular-related diseases feature more prominently in the leading causes of death (AIHW 2010).
Figure 2 displays an apparent difference in the average number of conditions causing death among people aged 65 or more over the period 2003 to 2007 compared with the period 1997 to 2002. This was due to a substantial increase in the number of deaths where hypertensive diseases were coded as an associated cause of death in 2003 onwards resulting from changes to the automated coding system for assigning causes of death (Walker 2012, personal communication).
Figure 2: Average number of diseases contributing to natural cause deaths, by age group and year, 1997-2007
Note: Data for 2006 and 2007 are preliminary data and are subject to revision.
Source: AIHW analysis of AIHW National Mortality Database.
Variation in multiple causes of death by sociodemographic characteristics
Indigenous status
Overall, there is little difference in the average number of diseases causing (natural) deaths between Indigenous and non-Indigenous Australians; for deaths during 2001-2007, on average, 3.2 causes contributed to Indigenous deaths and 3.0 causes contributed to non-Indigenous deaths. However, the average life expectancy for Indigenous Australians is much lower than for non-Indigenous Australians; Indigenous life expectancy for 2005-2007 is estimated to be 67.2 years for males, which is 11.5 years lower than for non-Indigenous males, and 72.9 years for females, which is 9.7 years lower than for non-Indigenous females (ABS 2009).
Despite similarities in the average number of causes contributing to death overall, the proportion of deaths having a single cause was 17.7% for Indigenous deaths and 20.9% for non-Indigenous deaths (Figure 3). The proportion of deaths having two and three contributing causes was 21.4% and 21.7% for Indigenous deaths respectively, and 23.6% and 23.2% for non-Indigenous deaths respectively. The proportion of Indigenous deaths having five or more causes was greater than among non-Indigenous deaths (21.8% compared with 16.2%).
Figure 3: Deaths by number of diseases contributing to natural cause deaths by Indigenous status, 2001-2007
Notes
- Data are for New South Wales, Queensland, South Australia and Northern Territory.
- Data for 2006 and 2007 are preliminary data and are subject to revision.
Source: AIHW analysis of AIHW National Mortality Database.
Socioeconomic status and remoteness of area of residence
There is no apparent relationship between the average number of causes contributing to deaths and different levels of socioeconomic status (SES) or remoteness of area of usual residence. The condition reported as the underlying cause and the age at death tend to have greater influences on the number and types of causes contributing to death (as shown elsewhere in the bulletin). Summary measures of multiple causes by SES and remoteness of area of usual residence are presented in Table 2.
The difference in the average number of diseases contributing to deaths between the lowest SES and the highest SES groups (3.2 and 3.1, respectively) is small, and there is no apparent social gradient. Similarly, in comparing different remoteness areas, although there is no apparent gradient, the average number of diseases contributing to deaths among people living in very remote areas is slightly higher compared with people living in all other areas.
The analyses presented here, by levels of socioeconomic status or remoteness by area of usual residence, provide little insight into factors influencing multiple causes of death.
| Category | Socioeconomic status of area of usual residence - Lowest SES | Socioeconomic status of area of usual residence - 2 | Socioeconomic status of area of usual residence - 3 | Socioeconomic status of area of usual residence - 4 | Socioeconomic status of area of usual residence - Highest SES |
|---|---|---|---|---|---|
| Number of deaths | 29,471 | 29,032 | 24,608 | 22,025 | 22,055 |
| Number of multiple causes | 93,343 | 92,171 | 77,777 | 68,428 | 68,848 |
| Average number of diseases per death | 3.2 | 3.2 | 3.2 | 3.1 | 3.1 |
| Category | Remoteness of area of usual residence - Major cities | Remoteness of area of usual residence - Inner regional | Remoteness of area of usual residence - Outer regional | Remoteness of area of usual residence - Remote | Remoteness of area of usual residence - Very remote |
|---|---|---|---|---|---|
| Number of deaths | 237,469 | 87,805 | 39,988 | 4,804 | 2,434 |
| Number of multiple causes | 754,066 | 270,437 | 123,816 | 15,152 | 8,012 |
| Average number of diseases per death | 3.2 | 3.1 | 3.1 | 3.2 | 3.3 |
SES = socioeconomic status
Notes
- Data for 2006 and 2007 are preliminary data and are subject to revision.
- 371 deaths were excluded in the analysis by socioeconomic area due to unknown area of residence.
- 967 deaths were excluded from the analysis by remoteness area due to unknown area of residence.
Source: AIHW analysis of AIHW National Mortality Database.
Variation in multiple causes of death by underlying cause
Some conditions contribute to death more often than is apparent from estimates based on only the underlying causes of death. Rate ratios (as described in Box 2) are used to summarise the differences between reporting estimates of mortality using multiple cause of death data compared with using only the underlying cause.
Broad categories of cause of death
Diseases usually coded as the underlying cause of death
For most of the broad categories of cause of death, the disease is more often reported as an associated cause than as the underlying cause. This is indicated by a rate ratio of more than 2.0 (Table 3). The exceptions to this are deaths with an underlying cause of cancers, diseases of the circulatory system, and maternal, perinatal and congenital conditions. In deaths involving cancers, maternal, perinatal and congenital conditions and diseases of the circulatory system, these conditions were coded as the underlying cause in 88%, 79% and 60% of deaths respectively. Put another way, for these cause groups, when all causes of death are considered, there is an additional 12% of deaths involving cancers, an additional 21% of deaths involving maternal, perinatal and congenital conditions, and an additional 40% of deaths involving circulatory system diseases compared with deaths represented by the underlying cause data.
Diseases usually coded as associated causes of death
For all broad cause groups other than cancers, diseases of the circulatory system, and maternal, perinatal and congenital conditions, a disease from the group was coded as the underlying cause in fewer than half of the deaths involving the disease—ranging from 12% of all deaths due to diseases of the blood, to 44% of deaths due to diseases of the nervous system (Table 3).
Of all deaths where infectious and parasitic diseases, diseases of the blood, skin diseases, musculoskeletal diseases and genitourinary diseases contributed to the death, fewer than 20% had these causes as the underlying cause.
Describing these outcomes using rate ratios shows the extent to which describing patterns of causes of death using only the underlying cause underestimates the contribution of some diseases to death. For example, if all deaths involving diseases of the blood and musculoskeletal, genitourinary, and infectious and parasitic diseases are considered, mortality is 8.0, 5.4, 5.3 and 5.1 times as high, respectively, as rates based on the underlying cause only. For skin, endocrine and respiratory diseases, mortality is 4.7, 3.6 and 3.6 times as high, respectively, as would be apparent from analyses based on the underlying cause only (Table 3).
| Disease category(a) | Underlying cause - Number of deaths | Underlying cause - Deaths per 100,000 | Associated cause - Number of deaths(b) | Associated cause - Deaths per 100,000 | Multiple cause - Number of deaths(b) | Multiple cause - Deaths per 100,000 | Per cent underlying(c) | Rate ratio(d) |
|---|---|---|---|---|---|---|---|---|
| Infectious and parasitic diseases | 1,858 | 8.8 | 7,754 | 36.8 | 9,437 | 44.8 | 19.7 | 5.1 |
| Cancers | 40,287 | 191.2 | 13,559 | 64.3 | 45,855 | 217.6 | 87.9 | 1.1 |
| Diseases of the blood | 479 | 2.3 | 3,419 | 16.2 | 3,845 | 18.2 | 12.5 | 8.0 |
| Endocrine diseases | 5,355 | 25.4 | 14,842 | 70.4 | 19,328 | 91.7 | 27.7 | 3.6 |
| Mental and behavioural disorders | 5,715 | 27.1 | 13,722 | 65.1 | 18,891 | 89.6 | 30.3 | 3.3 |
| Diseases of the nervous system | 5,467 | 25.9 | 7,513 | 35.7 | 12,491 | 59.3 | 43.8 | 2.3 |
| Diseases of the circulatory system | 46,232 | 219.4 | 62,002 | 294.2 | 76,508 | 363.1 | 60.4 | 1.7 |
| Diseases of the respiratory system | 11,396 | 54.1 | 34,416 | 163.3 | 40,468 | 192.0 | 28.2 | 3.6 |
| Diseases of the digestive system | 4,760 | 22.6 | 9,210 | 43.7 | 12,365 | 58.7 | 38.5 | 2.6 |
| Diseases of the skin | 362 | 1.7 | 1,364 | 6.5 | 1,701 | 8.1 | 21.3 | 4.7 |
| Musculoskeletal system diseases | 1,091 | 5.2 | 4,991 | 23.7 | 5,883 | 27.9 | 18.5 | 5.4 |
| Genitourinary system diseases | 3,324 | 15.8 | 15,348 | 72.8 | 17,755 | 84.3 | 18.7 | 5.3 |
| Maternal, perinatal and congenital conditions | 1,157 | 5.5 | 800 | 3.8 | 1,468 | 7.0 | 78.8 | 1.3 |
| All natural causes | 127,562 | 605.3 | .. | .. | .. | .. | .. | .. |
- For the full name of the disease category and the ICD-10 codes that define the category, see Appendix Table A1.
- The information in this table refers to counts of deaths, therefore at the all (natural) causes level, the totals for associated causes and multiple causes of death are not applicable.
- Refers to the per cent of deaths involving the specified disease, where that disease was recorded as the underlying cause of death.
- The rate ratio is the rate for the deaths as multiple causes divided by the rate for the deaths as the underlying cause.
Notes
- Deaths for 2007 are based on preliminary data and are subject to revision.
- The total for all natural causes includes 8 deaths due to an underlying cause of diseases of the eye and adnexa and ear and mastoid processes, and 71 deaths due to Sudden Infant Death Syndrome.
Source: AIHW analysis of AIHW National Mortality Database.
Selected chronic diseases causes of death
Chronic diseases usually coded as the underlying cause of death
The majority of deaths involving colorectal, liver, lung, breast and prostate cancers have the particular cancer captured as the underlying cause—from 93% for lung cancer to 67% for prostate cancer deaths (Table 4).
The rate ratio indicates the extent to which causes of death are captured in the multiple causes relative to the underlying cause. The rate ratios for deaths involving the selected cancers are less than 2.0; this indicates that for deaths involving these cancers, more than 50% of the time the disease is reported as the underlying cause. In considering mortality for all deaths where colorectal, breast and prostate cancers contributed to the death, the mortality rates would be 20%, 30% and 50% higher respectively than the rate based on deaths where the diseases were reported as the underlying cause. For liver and lung cancer the rate would be 10% higher than the rate for these diseases as the underlying cause (Table 4).
For deaths involving CHD and cerebrovascular diseases, 62% and 57% respectively are captured in the underlying cause. The death rates for these causes would be 60% and 80% higher than the rate for the underlying cause, when considering the overall contribution of these diseases to death (Table 4).
Chronic diseases usually coded as an associated cause of death
For some chronic diseases, most of their role in contributing to deaths is not captured in analyses of the underlying cause only. Of the deaths involving chronic and unspecified kidney failure, 17% are represented in the underlying cause (Table 4). For diabetes this figure was 29% and for dementia and Alzheimer disease, 42%. When considering the contributory role of these conditions, the mortality rate would be 5.9, 3.4 and 2.4 times as high, respectively, as the underlying cause mortality rate.
More than 2 in 5 deaths (42%) involving COPD and 30% of deaths involving asthma are captured in the underlying cause. The mortality rates are 2.4 and 3.4 times as high as the underlying cause rates, if their total involvement in causing death is considered.
| Chronic diseased(a) | Underlying cause - Number of deaths | Underlying cause - Deaths per 100,000 | Associated cause - Number of deaths | Associated cause - Deaths per 100,000 | Multiple cause - Number of deaths | Multiple cause - Deaths per 100,000 | Per cent underlying(c) | Rate ratio(d) |
|---|---|---|---|---|---|---|---|---|
| Colorectal cancer | 4,107 | 19.5 | 772 | 3.7 | 4,861 | 23.1 | 84.5 | 1.2 |
| Liver cancer | 1,109 | 5.3 | 115 | 0.5 | 1,223 | 5.8 | 90.7 | 1.1 |
| Lung cancer | 7,626 | 36.2 | 581 | 2.8 | 8,198 | 38.9 | 93.0 | 1.1 |
| Breast cancer(b) | 2,680 | 25.3 | 780 | 7.4 | 3,460 | 32.7 | 77.5 | 1.3 |
| Prostate cancer(b) | 2,938 | 28.0 | 1,419 | 13.5 | 4,357 | 41.6 | 67.4 | 1.5 |
| Diabetes | 3,810 | 18.1 | 9,203 | 43.7 | 12,942 | 61.4 | 29.4 | 3.4 |
| Dementia and Alzheimer disease | 7,320 | 34.7 | 10,510 | 49.9 | 17,410 | 82.6 | 42.0 | 2.4 |
| Coronary heart disease | 22,729 | 107.9 | 20,758 | 98.5 | 36,748 | 174.4 | 61.9 | 1.6 |
| Cerebrovascular disease | 11,491 | 54.5 | 10,394 | 49.3 | 20,252 | 96.1 | 56.7 | 1.8 |
| Chronic obstructive pulmonary disease | 5,152 | 24.4 | 7,166 | 34.0 | 12,178 | 57.8 | 42.3 | 2.4 |
| Asthma | 385 | 1.8 | 918 | 4.4 | 1,303 | 6.2 | 29.5 | 3.4 |
| Chronic and unspecified kidney failure | 2,046 | 9.7 | 10,082 | 47.8 | 12,113 | 57.5 | 16.9 | 5.9 |
- For the ICD-10 codes that define each chronic disease, see Appendix Table A2.
- Breast cancer deaths are for females only; breast cancer and prostate cancer rates are for the female and male populations, respectively.
- Refers to the per cent of deaths involving the specified chronic disease, where that disease was recorded as the underlying cause of death.
- The rate ratio is the rate for the deaths as multiple causes divided by the rate for the deaths as the underlying cause.
Note: Deaths for 2007 are based on preliminary data and are subject to revision.
Source: AIHW analysis of AIHW National Mortality Database.
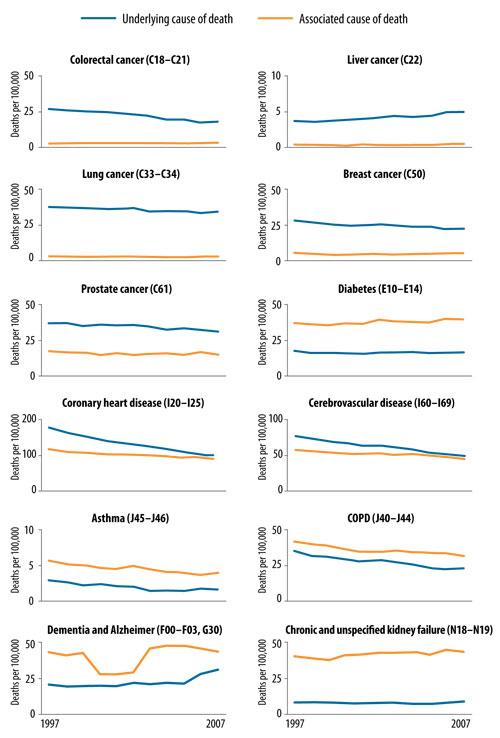
Trends in multiple causes of death for chronic diseases
Figure 4 shows trends over the period 1997 to 2007 for deaths due to the selected chronic diseases coded as the underlying cause and as an associated cause. The figure indicates the following:
- As shown earlier, deaths involving the selected cancers are more likely to be indicated as the underlying cause. This pattern is consistent over time.
- For diabetes, more deaths involving this disease are indicated by the associated causes of death than as the underlying cause of death. The mortality rates for diabetes as the underlying cause declined overall between 1997 and 2007 by 7% and mortality due to diabetes reported as an associated cause has increased by 7%.
- During the period 1997 to 2007, mortality due to both CHD and cerebrovascular diseases as represented by both the underlying and associated causes declined. As the underlying cause, the CHD mortality rate declined by 44% and for cerebrovascular disease, by 35%. The decline in the mortality rates indicated by the associated cause data was smaller—23% for CHD deaths and 22% for cerebrovascular deaths.
- The mortality rates for COPD and asthma deaths declined during the period of this analysis, for both underlying and associated causes. For asthma, the age-standardised mortality rate using the underlying cause declined from 2.9 deaths per 100,000 population to 1.7. For the associated cause, the rate declined from 5.6 deaths per 100,000 population to 4.0. The respective figures for COPD as the underlying cause were 34.3 and 22.4 deaths per 100,000 population and as an associated cause, 41.0 and 31.2.
- Deaths due to dementia and Alzheimer disease have been influenced by coding changes and changes in certification practices. In 2000, changes to the coding process resulted in a break in the time series for dementia deaths indicated as an associated cause. From 2006 there was a substantial increase in the number of deaths due to dementia and Alzheimer disease (as the underlying cause), compared with earlier years. This was attributed in part to the changes to defence veterans' entitlements that now allow for death from vascular dementia to be related to defence service and a subsequent promotional campaign around this targeted at health professionals (ABS 2008). Specifically, this has resulted in some deaths that were previously coded to cerebrovascular diseases being coded to vascular dementia.
- Death rates due to chronic and unspecified kidney failure show an increased incidence of mortality when the contributory role of this disease, rather than only underlying cause, is considered. This pattern is consistent over time; the age-standardised mortality rate for chronic and unspecified kidney failure as an associated cause was 5.0 times that of the rate using the underlying cause, in 1997 and in 2007.
Figure 4: Age-standardised mortality rates (deaths per 100,000) for deaths due to selected chronic diseases, as the underlying cause and associated causes of death, 1997-2007
Notes
- Rates are age-standardised to the Australian estimated resident population of 30 June 2001.
- Deaths for 2006 and 2007 are based on preliminary data and are subject to revision.
Source: AIHW analysis of AIHW National Mortality Database.
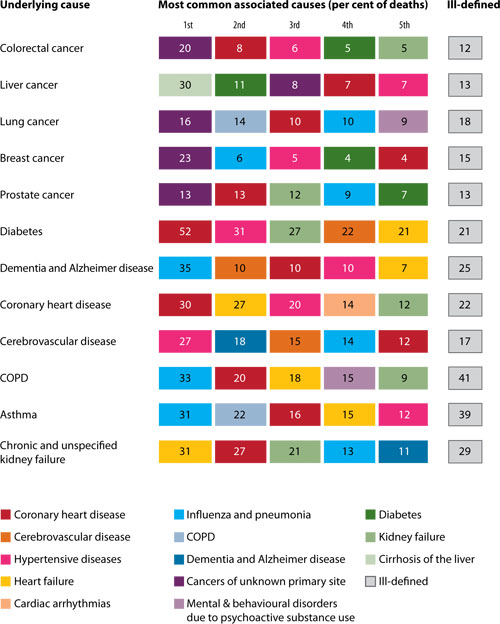
Patterns of contributory causes of death
Deaths with chronic diseases as the underlying cause of death
This section describes the leading associated causes of death; that is, the diseases most often associated with each specific chronic disease as the underlying cause.
For each of the selected chronic diseases, the associated causes of death were ranked using an AIHW-modified version of the WHO-recommended classification for deriving leading causes of death (Becker et al. 2006). Figure 5 shows the five leading diseases most commonly recorded as associated causes for each of the chronic diseases as the underlying cause.
Cancers of unknown primary site were associated with all cancer deaths reported here. They contributed to 20% of colorectal, 8% of liver, 16% of lung, 23% of breast and 13% of prostate cancer deaths. The leading associated cause of death with liver cancer was cirrhosis of the liver, in 30% of these deaths. CHD featured as a leading associated causes of death among deaths with an underlying cause of cancer. Diabetes also featured as a leading associated cause for the selected cancers, except for lung cancer.
Hypertensive diseases featured in the five leading associated cause of death for most chronic disease underlying causes of death, in particular diabetes (31%), cerebrovascular diseases (27%) and CHD (20%).
CHD featured among the five leading associated causes of death for all the chronic disease underlying causes of death shown in Figure 5; it was involved in 52%, 27% and 20% of deaths due to diabetes, chronic and unspecified kidney failure and COPD respectively. In 30% of deaths where CHD occurred as the underlying cause of death, another form of CHD was also reported as an associated cause.
Influenza and pneumonia featured often as a leading associated cause of death. Both of these diseases provide an obvious target for treatment and opportunity for improving quality of life or potentially preventing some deaths due to the chronic disease with which it is associated. Influenza and pneumonia contributed to 35% of deaths due to dementia and Alzheimer disease, 33% of COPD deaths and 31% of asthma deaths.
Ill-defined diseases were indicated among the leading associated causes of death in this analysis; ill-defined conditions were coded as associated causes for 41% of COPD deaths, for 39% of asthma deaths and for 29% of chronic and unspecified kidney failure deaths. Despite the estimated completeness of coverage of deaths in Australia and high-quality processing and coding of causes of death, the high proportion of ill-defined conditions raises issues around the quality of documentation of causes of death.
Figure 5: Most common associated causes of death for selected chronic diseases as the underlying cause, 2005-2007
Notes
- For each chronic disease recorded as the underlying cause of death, the figure above shows the commonly reported associated causes.
- Deaths for 2006 and 2007 are based on preliminary data and are subject to revision.
Source: AIHW analysis of AIHW National Mortality Database.
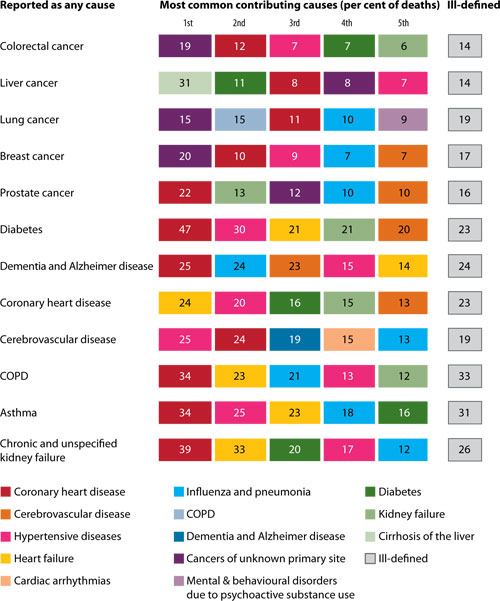
Deaths with chronic diseases as any cause of death
The following analysis is based on deaths where the chronic diseases were coded as any cause type (that is, as the underlying or as an associated cause). For these deaths, the contribution of other causes of death (also coded to either the underlying or associated causes) is assessed. The most commonly occurring contributory causes with each of the selected chronic diseases are shown in Figure 6.
Figure 6: Most common contributing causes of death for selected chronic diseases reported as multiple causes, 2005-2007
Notes
- For each chronic disease recorded as either an underlying or associated cause of death, the figure shows the commonly reported contributing causes.
- Deaths for 2006 and 2007 are based on preliminary data and are subject to revision.
Source: AIHW analysis of AIHW National Mortality Database.
For these chronic diseases as any type of cause (underlying or associated), the patterns of other diseases as contributing causes is similar to those for the chronic diseases as the underlying cause.
Hypertensive diseases featured as a leading contributor to deaths involving selected chronic diseases, in particular diabetes (30%), cerebrovascular diseases and asthma, (each 25%), CHD (20%) and chronic and unspecified kidney failure (17%).
CHD is a most frequently contributing condition in deaths for most of the chronic conditions reported here. It is indicated as contributing to 47% of deaths involving diabetes, 39% involving chronic and unspecified kidney failure and 34% of deaths involving each of COPD and asthma.
Diabetes was a common contributory cause, in particular for deaths involving chronic and unspecified kidney failure (20%), CHD (16%) and asthma (16%).
Cerebrovascular diseases commonly contributed to chronic disease deaths that also involved dementia and Alzheimer disease (23%), diabetes (20%) and CHD (13%).
Age at death for selected chronic diseases
Patterns of age at death were examined for any variation between deaths where the chronic disease was reported as the underlying cause or as an associated cause. The median age at death and the average number of causes reported on the death certificates for the reported chronic disease deaths, as both the underlying cause and associated cause, are shown in Table 5.
People dying with one of the selected cancers as the underlying cause were, on average younger than those who died with one of these cancers recorded as an associated cause (Table 5). The average age at death for people dying from the condition as an underlying cause was marginally higher for diabetes, dementia and Alzheimer disease, CHD, cerebrovascular disease, and chronic and unspecified kidney failure, although in these cases the age differences were smaller.
For all deaths where the chronic disease was reported as an associated cause, there were on average more causes reported on the death certificate compared with deaths where the chronic disease was reported as the underlying cause (Table 5).
| Cause of death | Chronic disease reported as the underlying cause - Average number of causes per death | Chronic disease reported as the underlying cause - Median age at death | Chronic disease reported as an associated cause - Average number of causes per death | Chronic disease reported as an associated cause - Median age at death |
|---|---|---|---|---|
| Colorectal cancer | 2.4 | 74 | 4.7 | 81 |
| Liver cancer | 2.7 | 72 | 4.7 | 73 |
| Lung cancer | 2.5 | 73 | 4.3 | 77 |
| Breast cancer | 2.3 | 67 | 4.5 | 83 |
| Prostate cancer | 2.5 | 80 | 4.5 | 83 |
| Diabetes | 4.3 | 80 | 4.7 | 79 |
| Dementia and Alzheimer disease | 2.9 | 87 | 4.1 | 86 |
| Coronary heart disease | 3.5 | 83 | 4.4 | 82 |
| Cerebrovascular disease | 3.1 | 84 | 4.4 | 83 |
| Asthma | 3.6 | 80 | 4.5 | 80 |
| COPD | 3.6 | 79 | 5.0 | 81 |
| Chronic and unspecified kidney failure | 3.6 | 84 | 4.8 | 82 |
Note: Deaths for 2007 are based on preliminary data and are subject to revision.
Source: AIHW analysis of AIHW National Mortality Database.