What types of medical practitioners are there?
Medical practitioners work in a range of different roles, including as clinicians, administrators, teachers/educators and researchers. Among clinicians the key roles include general practitioners, specialists, hospital non-specialists and specialists-in-training.
General practitioners
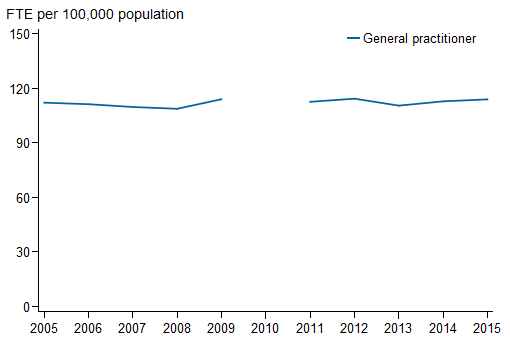
The rate of supply of general practitioners in Australia remained relatively steady between 2005 and 2015, ranging from 109 per 100,000 population in 2008 to 114 in 2009, 2012 and 2015 (Figure 1). Provisional registrants are included in data for earlier years so they are not completely comparable with data for later years.
The average age of general practitioners increased between 2005 and 2015 (from 48.6 to 51.4) though some of the increase may be attributed to the exclusion of Australian General Practice Training program trainees from the 'General practitioner' category from 2013 and the inclusion of provisional registrants in years prior to 2012.
General practitioners had the highest proportion aged 55 or older (40.5%) of all clinician groups in 2015.
The proportion of general practitioners who were women increased from 36.5% in 2005 to 42.1% in 2015.
Figure 1: Full-time equivalent employed general practitioners per 100,000 population, 2005 to 2015
Notes
- Data prior to 2010 have been presented to show trends for the period before the introduction of the National Registration and Accreditation Scheme. In 2010, due to transitional arrangements, survey data were not available for Western Australia and Queensland. As a result, national data are not available.
- Provisional registration is granted to medical practitioners to enable them to complete a period of supervised practice or internship to be eligible for general registration. This type of registration is intended for practitioners who have completed a Medical Board-approved, accredited qualification in the profession. Data prior to 2010 were based on state/territory-based registration systems and, as a result, treatment of provisional registrants was not consistent across the jurisdictions. Data for 2011 include 2,945 provisional registrants. From 2012, data exclude provisional registrants.
- FTE is based on total weekly hours worked. Standard working week is defined as 40 hours.
Sources: AIHW Medical Labour Force Survey (2005 to 2009); NHWDS: medical practitioners (2011 to 2015).
Specialists
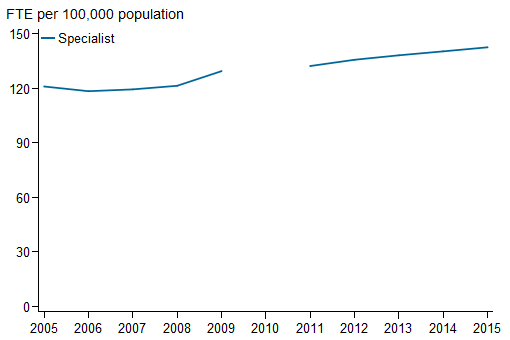
From 2005 to 2015, there was growth in the rate of supply of specialists, from 121 to 143 per 100,000 population (Figure 2). The number of specialists working as clinicians also increased between 2005 and 2015 (from 19,943 to 29,269). Provisional registrants are included in data for earlier years so they are not completely comparable with data for later years.
The average age for clinician specialists was 50.1 in 2015, compared with 49.2 in 2005.
In 2015, over a quarter (29.5%) of clinician specialists were women, the lowest proportion of all clinician groups but up from 20.9% in 2005.
Figure 2: Full-time equivalent employed specialists per 100,000 population, 2005 to 2015
Notes
- Data prior to 2010 have been presented to show trends for the period before the introduction of the National Registration and Accreditation Scheme. In 2010, due to transitional arrangements, survey data were not available for Western Australia and Queensland. As a result, national data are not available.
- Provisional registration is granted to medical practitioners to enable them to complete a period of supervised practice or internship to be eligible for general registration. This type of registration is intended for practitioners who have completed a Medical Board-approved, accredited qualification in the profession. Data prior to 2010 were based on state/territory-based registration systems and, as a result, treatment of provisional registrants was not consistent across the jurisdictions. Data for 2011 include 2,945 provisional registrants. From 2012, data exclude provisional registrants.
- FTE is based on total weekly hours worked. Standard working week is defined as 40 hours.
Sources: AIHW Medical Labour Force Survey (2005 to 2009); NHWDS: medical practitioners (2011 to 2015).
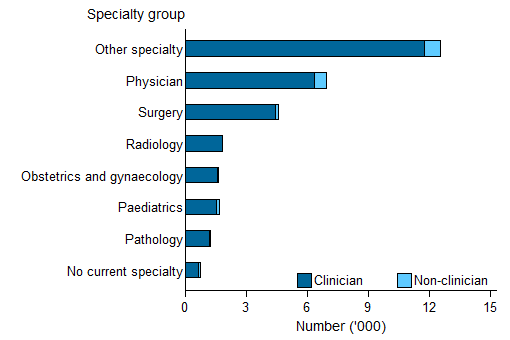
There are over 80 specialties that a medical practitioner can specialise in. Many of these can be grouped into the specialty groups identified in Figure 3. However, there are a large number of specialties that can not be readily grouped and these are included in the 'other specialty' category.
Excluding the 'other specialty' category, in 2015, 'physician' was the broad specialty group with the highest number of clinicians (6,340 or 21.7% of all clinicians). 'Surgery' was the second largest broad specialty group (4,422 or 15.1%) (Figure 3).
Figure 3: Number of employed specialists, by main specialty of practice broad group and clinician status, 2015
Notes
- Other specialty includes addiction medicine, anaesthesia, dermatology, emergency medicine, general practice, intensive care medicine, medical administration, occupational and environmental medicine, ophthalmology, pain medicine, palliative medicine, psychiatry, public health medicine, radiation oncology, rehabilitation medicine, sexual health medicine and sport and exercise medicine.
- Clinician is a medical practitioner who spends the majority of their time in the area of clinical practice.
Source: NHWDS: medical practitioners 2015.
In terms of the individual specialties, the 5 most common specialties accounted for 38.8% of clinician specialists (Table 1).
Anaesthesia was the most common specialty in 2015 (3,881 or 13.3% of clinician specialists), followed by psychiatry (2,923 or 10.0% of clinician specialists).
The average age for medical practitioners in the 'General medicine' specialty was 56.6 — 6 years higher than the average age of 50.1 for all clinician specialists. 'Emergency medicine' specialists were one of the youngest clinician specialists groups with an average age of 45.3. The proportion of women who were clinician specialists was lowest for orthopaedic surgery at 3.3%, and highest for endocrinology at 51.1% (Table 1).
| Main specialty of practice | Number | Average age (years) |
Women (per cent) |
Average weekly hours worked |
|---|---|---|---|---|
| Anaesthesia | 3,881 | 48.5 | 28.3 | 42.1 |
| Psychiatry | 2,923 | 53.1 | 38.0 | 38.2 |
| Diagnostic radiology | 1,788 | 49.9 | 25.0 | 41.9 |
| Emergency medicine | 1,376 | 45.3 | 31.8 | 41.0 |
| Specialist obstetrician and gynaecologist | 1,375 | 51.6 | 42.8 | 46.8 |
| General surgery | 1,316 | 51.9 | 14.4 | 49.4 |
| Orthopaedic surgery | 1,168 | 51.8 | 3.3 | 49.0 |
| General paediatrics | 1,080 | 51.3 | 46.9 | 41.1 |
| Cardiology | 1,040 | 49.3 | 13.1 | 49.6 |
| Ophthalmology | 862 | 53.0 | 18.8 | 42.4 |
| Anatomical pathology | 737 | 50.4 | 47.2 | 40.2 |
| Gastroenterology and hepatology | 664 | 48.8 | 19.6 | 46.4 |
| General medicine | 655 | 56.6 | 19.7 | 42.9 |
| Specialist intensive care medicine | 558 | 47.5 | 16.8 | 54.1 |
| Geriatric medicine | 511 | 47.4 | 45.6 | 40.1 |
| Respiratory and sleep medicine | 483 | 48.4 | 23.2 | 46.5 |
| Endocrinology | 470 | 47.6 | 51.1 | 38.9 |
| Dermatology | 459 | 51.1 | 43.1 | 39.6 |
| Medical oncology | 448 | 46.0 | 39.3 | 45.7 |
| Neurology | 447 | 50.9 | 24.4 | 44.3 |
| Other | 6,366 | 50.6 | 29.9 | 44.6 |
| No current specialty | 662 | 42.9 | 37.0 | 45.4 |
| Total | 29,269 | 50.1 | 29.5 | 43.7 |
Note: Clinician is a medical practitioner who spends the majority of their time in the area of clinical practice.
Source: NHWDS: medical practitioners 2015.
Hospital non-specialists
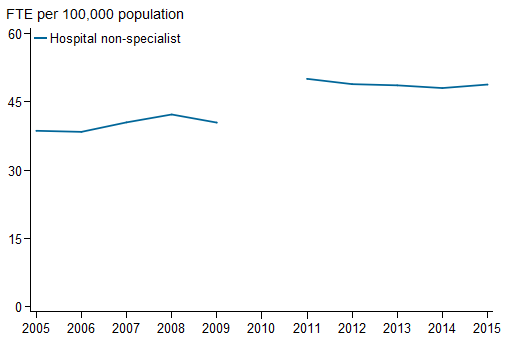
From 2005 to 2015, the number of hospital non-specialists working in a clinical role grew from 6,632 to 9,745. This represented an increase in the full-time equivalent rate from 38.6 hospital non-specialists per 100,000 population in 2005 to 48.8 in 2015 (Figure 4). Some of this increase may be accounted for by improved data collection through the introduction of the Medical Workforce Survey in 2010, as part of the National Registration and Accreditation Scheme.
The average age for clinician hospital non-specialists was 33.4 in 2015, slightly older than in 2005 (32.2). Hospital non-specialists were the youngest group among clinicians in 2015.
The proportion of women clinician hospital non-specialists decreased from 48.3% in 2005 to 46.7% in 2015. The proportion is high in comparison to general practitioners and specialists.
Figure 4: Full-time equivalent employed hospital non-specialists per 100,000 population, 2005 to 2015
Notes
-
Data prior to 2010 have been presented to show trends for the period before the introduction of the National Registration and Accreditation Scheme. In 2010, due to transitional arrangements, survey data were not available for Western Australia and Queensland. As a result, national data are not available.
-
Provisional registration is granted to medical practitioners to enable them to complete a period of supervised practice or internship to be eligible for general registration. This type of registration is intended for practitioners who have completed a Medical Board-approved, accredited qualification in the profession. Data prior to 2010 were based on state/territory-based registration systems and, as a result, treatment of provisional registrants was not consistent across the jurisdictions. Data for 2011 include 2,945 provisional registrants. From 2012, data exclude provisional registrants.
- FTE is based on total weekly hours worked. Standard working week is defined as 40 hours.
Sources: AIHW Medical Labour Force Survey (2005 to 2009); NHWDS: medical practitioners (2011 to 2015).
Specialists-in-training
There are two ways in which medical practitioners could indicate that they were specialists-in-training—either reporting that their main job was 'specialist-in-training', or that they were in a recognised specialist training program. Some medical practitioners who reported that their main job was 'specialist-in-training' did not report that they were in a recognised specialist training program.
In 2015, the most common specialty of training among those in a recognised specialist-in-training program was general practice (4,228 or 26.0%) and the most common specialty for those whose main job was reported as specialist-in-training was the physician group (2,371 or 15.5%).
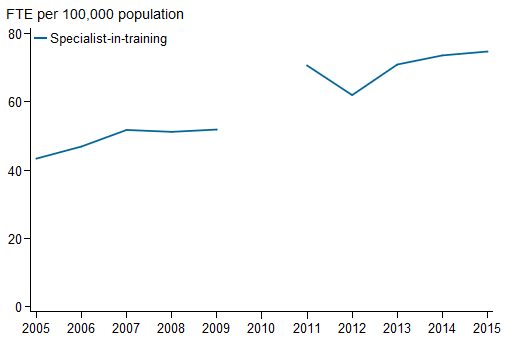
From 2005 to 2015, there was overall growth in the rate of full-time employed specialists-in-training, from 43.4 to 74.8 per 100,000 population (Figure 5).
Women made up half (51.3%) of all clinician specialists-in-training in 2015. This was far greater than the proportion of practicing specialists who were women (29.5%) in 2015, which suggests that the sex distribution of practicing specialists may equalise into the future.
The average age of clinician specialists-in-training (33.9 in 2015) was relatively young compared with specialists and general practitioners (50.1 and 51.4 in 2015, respectively).
Figure 5: Full-time equivalent employed specialists-in-training per 100,000 population, 2005 to 2015
Notes
- Data prior to 2010 have been presented to show trends for the period before the introduction of the National Registration and Accreditation Scheme. In 2010, due to transitional arrangements, survey data were not available for Western Australia and Queensland. As a result, national data are not available.
- Provisional registration is granted to medical practitioners to enable them to complete a period of supervised practice or internship to be eligible for general registration. This type of registration is intended for practitioners who have completed a Medical Board-approved, accredited qualification in the profession. Data prior to 2010 were based on state/territory-based registration systems and, as a result, treatment of provisional registrants was not consistent across the jurisdictions. Data for 2011 include 2,945 provisional registrants. From 2012, data exclude provisional registrants.
- FTE is based on total weekly hours worked. Standard working week is defined as 40 hours.
Sources: AIHW Medical Labour Force Survey (2005 to 2009); NHWDS: medical practitioners (2011 to 2015).
Non-clinicians
Registered medical practitioners may work in non-clinical roles. In the Medical Workforce Survey the following roles were identified:
- an administrator: employed in medical administration
- a teacher/educator: teaching or training people in medicine
- a researcher: engaged in medical research, or
- a non-clinical medical field that is not one of the above.
In 2015, there were 4,309 people employed as 'non-clinician medical practitioners', compared with 83,731 employed clinicians (4.9% of employed medical practitioners) (Figure 6). Non-clinicians were, on average, older than clinicians (52.8 and 45.6 years, respectively). They also tended to work fewer average weekly hours than clinicians (38.1 compared to 42.6).
Administrators were the largest group of employed non-clinicians (1,490 or 34.6% on non-clinicians), followed by researchers (1,319 or 24.5%). Researchers and administrators both reported the highest average weekly hours worked (41.2). Other non-clinicians were the oldest group with an average age of 58.4 years and teachers/educators had the highest proportion of women at 46.3%.
Figure 6: Number of employed non-clinician medical practitioners, by principal role in main job and sex, 2015
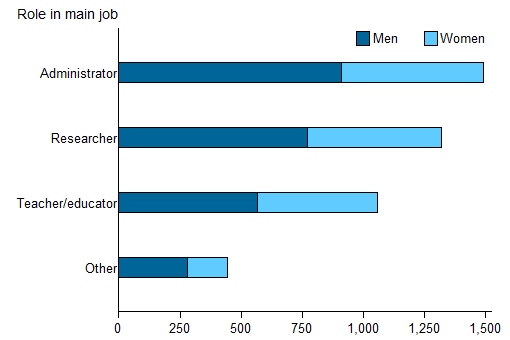
Source: NHWDS: medical practitioners 2015.