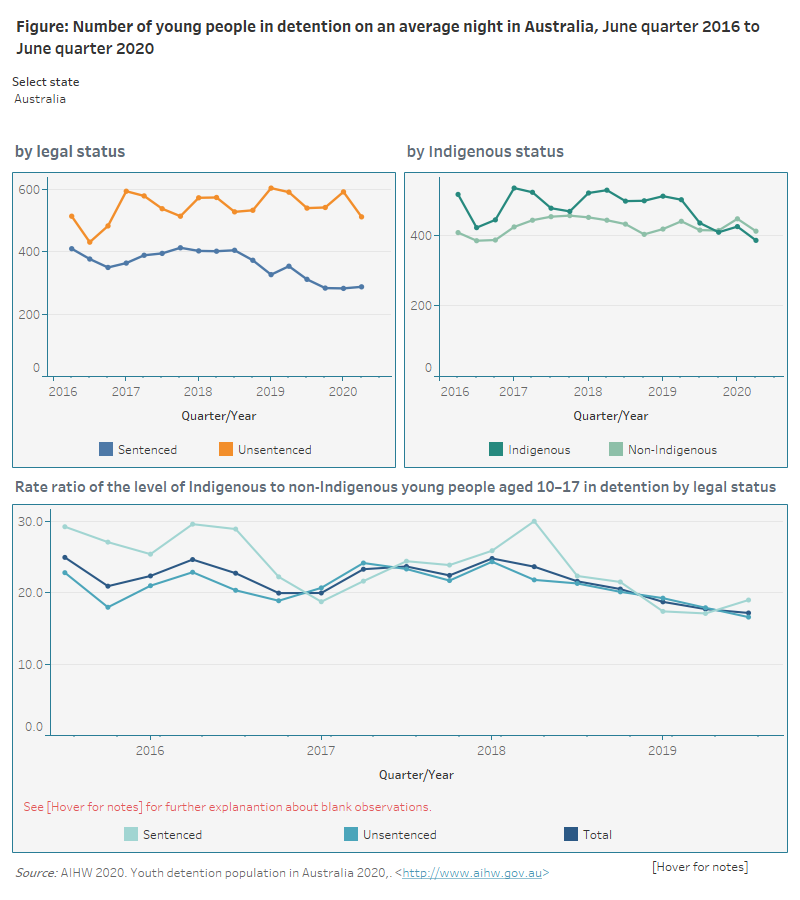
Trends in the youth detention
The first graph in this figure shows that more young people in detention were unsentenced than sentenced over the 4-year period. The number of young people in unsentenced detention and sentenced detention declined overall from the June quarter 2019.
The second graph in this figure shows that the proportion of young Indigenous Australians in detention was slightly higher than young non‑Indigenous Australians on an average night in almost every quarter throughout the 4-year period until the December quarter 2019. The number of young Indigenous Australians in detention on an average night declined since the March quarter 2019.
The third graph in this figure shows that over the 4-year period, the level of Indigenous over‑representation in detention fluctuated, at a rate 17–25 times the non-Indigenous rate.