Working age
For most Australians, the working-age phase of their lives is a time for starting and establishing careers, buying a home, and raising a family. This section looks at some of the characteristics that define this group as they move through this stage and into their older years.
Better educated
More than half of the Australian population—53%, or 12.5 million people—are aged between 25 and 64.
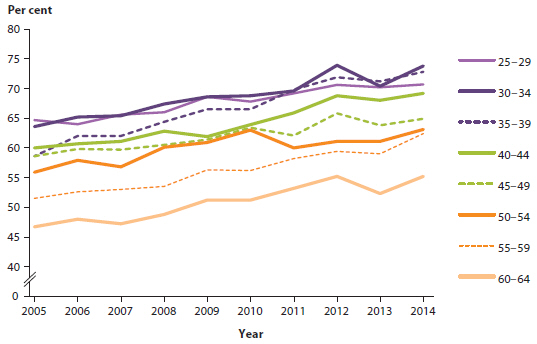
Overall, Australians in this age group are better educated than a decade ago, with 67% of 25–64 year olds having a non-school qualification, up from 58% in 2005. This is likely due to a combination of factors, including that people are now moving into this age group who are more highly qualified as a result of improvements in educational attainment over recent decades, and that working-age Australians are undertaking further study and/or retraining.
Women, in particular, have made more gains. While more men (62%) than women (54%) aged 25-64 had a non-school qualification in 2005, the gap has narrowed, with 69% of men and 66% of women having a non-school qualification in 2014.
Population aged 25–64 with a non-school qualification, by age group, 2005 to 2014
Women have changed the face of the workforce
The labour force participation for people aged 25–64 rose from 74% to 79% between 1992 and 2014. During this period, the male labour force participation rate fell slightly from 87% to 86%, and the female labour force participation rate rose from 60% to 72%.
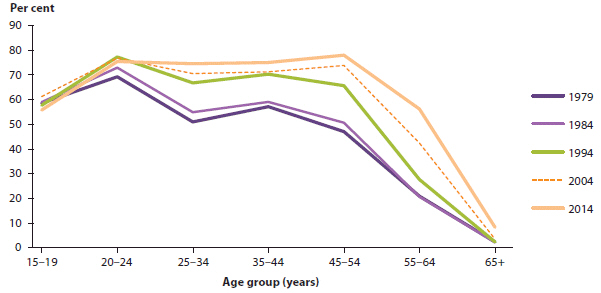
Labour force participation rates for women in the prime child-bearing years of 25–34 have risen in recent decades.
For example, in 1979, the labour force participation rate for women aged 25–34 was 51% compared with 69% for those aged 20–24. By 2014, the labour force participation rate for women aged 25-34 had climbed to 75%.
Older women are also more likely than in previous years to be in the labour force. The participation rate for women aged 55–64 rose from 21% in 1979 to 56% in 2014, and the rate for women aged 65 and over rose from 2% to 8%.
Female labour force participation rate, by age, 1979, 1984, 1994, 2004 and 2014
More of us working part-time
In 2014, although 75%—or 9.4 million—people aged 25–64 had a job, a higher proportion of people worked part-time than previously. In 2014, 25% of Australians aged 25-64 worked part-time, compared with 21% in 1992.
For both men and women aged 25–64, the average weekly full-time hours worked fell over this period, while the average weekly part-time hours increased.
In 2014, men aged 25–64 working full-time worked, on average, 41.4 hours a week compared with 42.5 hours in 1992, while women worked, on average, 36.9 hours in 2014 compared with 38.2 hours in 1992.
For men working part-time, the average weekly hours worked rose from 17.1 in 1992 to 18.8 in 2014, while for women they rose from 15.9 to 17.8 over the same period.
And we are staying at work
The labour force participation rate for those aged 55 and over rose steadily from 23% in 1984 to 35% in 2014.
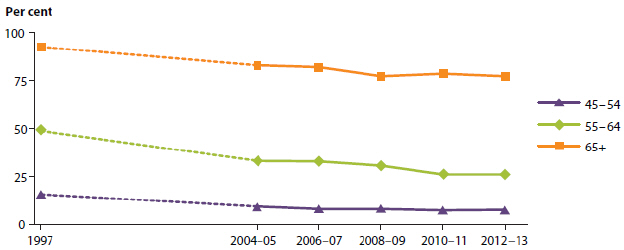
The proportion of Australians aged 55 and over who have retired fell between 1997 and 2012–13—from 49% to 26% for those aged 55–64, and from 93% to 77% for those aged 65 and over.
The main reason people gave for retiring from all work was that they had reached retirement age or were eligible for superannuation or the pension (37%).
This was followed by their own sickness, injury or disability (23%), and being retrenched, dismissed or having no work available (10%). Around 1 in 20 people reported that their retirement was due to their own business being closed down, or that they had retired to care for an ill, disabled or elderly person (5% for each).
Retirement rate, people aged 45 and over, by age, November 1997 to 2012–13
More households have a mortgage
While most Australian households continue to own their own homes, there has been a significant decline in the proportion that own their home outright, and a corresponding rise in the proportion that own their home with a mortgage.
The proportion of households that owned their homes with a mortgage rose from just under 30% in 1994–95 to 37% in 2011–12. In contrast, the proportion of households that owned their homes outright fell from 42% in 1994-95 to 31% in 2011–12.
In 2013–14, about 61,000 first home owner grants were paid to help Australians buy a home.
Housing tenure type, 1994–95 to 2011–12
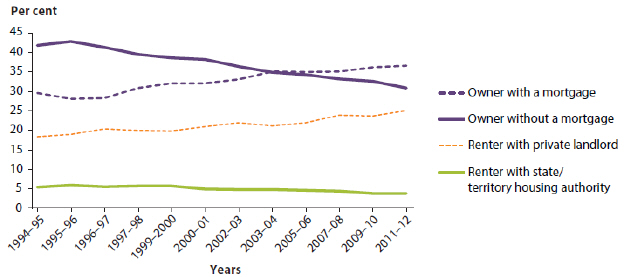
And more of us are renting
The proportion of households that are renting has increased over the past decade. In 2011-12, around 25% of all Australian households were renting from a private landlord, up from 18% in 1994–95. This rise has been partly associated with the increased cost of housing ownership discouraging renters from making the transition.
In 2011–12, about 4% of Australian households rented from a state or territory housing authority.
At June 2014, more than 390,000 households were living in social housing, and there were more than 200,000 applicants on social housing waiting lists across Australia.
Increase in low-income households in rental stress
The proportion of Australian households paying more than 30% of their income on rent increased from 35% in 2007–08 to 41% in 2011–12.
About 15–20% of Australian households currently receive some form of housing assistance, with the most common form being Commonwealth Rent Assistance.
In 2013–14, there were 1.3 million recipients of Commonwealth Rent Assistance.
Work and study are the top reasons for using child care
In 2014, an estimated 48% of all Australian children aged 0–12 (1.8 million children) regularly attended either formal or informal child care.
Families with higher weekly incomes were more likely to use formal child care than families with lower weekly incomes.
In 2014, parents used child care for:
- work and study reasons, or if they were looking for work (73%)
- benefits associated with preparing the child for school (18%)
- personal reasons, including entertainment, social reasons, or to give parents a break (8%).
It is estimated that grandparents provide informal care to nearly one-third of both working couple families and working one-parent families.