What are the types of multimorbidity and how common are they?
Not all people with multimorbidity share the same characteristics and experiences. Characteristics common among people with different types of multimorbidity, and the different experiences they have, are compared in the following sections. The multimorbidity types investigated are shown in Box 4.
Box 4: Classification of multimorbidity types in this analysis
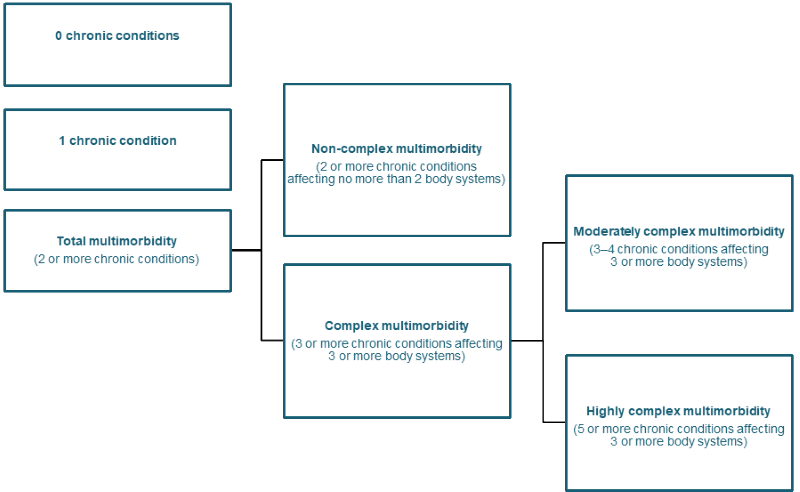
Complex multimorbidity is a subcategory of total multimorbidity and is described as the co-occurrence of 3 or more chronic conditions affecting 3 or more different body systems within a person at the same time (Harrison et al. 2014; Box 5). This is useful for identifying people with more complex health care needs as chronic conditions affecting different body systems may require co-ordination of multiple specialists—making treatment more complex, while the treatments of chronic conditions within the same body system may be more likely to be complementary (Harrison et al. 2014). Non-complex multimorbidity is described as the co-occurrence of 2 or more chronic conditions affecting no more than 2 body systems.
A body system is a group of organs and tissues that work together to perform specific functions.
The ABS NHS condition classification is based on the International Classification of Diseases and Related Health Problems (10th revision; ICD-10) (ABS 2019a). Chapter axes within the ICD-10 include body systems, aetiology and ‘others’. For consistency with the coding of NHS condition information, ICD chapters have been used as a proxy for body systems. The body systems and selected chronic conditions included in them for analysis are:
- Circulatory: selected cardiovascular diseases
- Endocrine, nutritional and metabolic: diabetes
- Genitourinary: chronic kidney disease
- Malignant neoplasms: cancer
- Musculoskeletal: arthritis, back problems, osteoporosis
- Psychological: mental and behavioural conditions
- Respiratory: asthma, COPD
See Calculating the prevalence of multimorbidity and complex multimorbidity types in the Methods section of the Technical notes for more information on how the 10 chronic conditions were grouped by ICD-10 chapter for the analysis of complex multimorbidity types.
Two types of complex multimorbidity are explored in this analysis: moderately complex multimorbidity (where 3–4 chronic conditions are present and affect 3 or more different body systems) and highly complex multimorbidity (where 5 or more chronic conditions are present and affect 3 or more different body systems).
In addition to considering how conditions across different body systems affect a person with multimorbidity, these groups allow us to explore differences when a large number of chronic conditions are present.
The majority of people with multimorbidity are aged 45 and over (74%); of those with either moderately or highly complex multimorbidity, 83% are aged 45 and over (ABS 2019b). For this reason, people aged 45 and over are the focus of analysis by type of multimorbidity. Analysis by age groups 45–64 and 65 and over is included in the Data tables (Box 6).
How common are different types of multimorbidity?
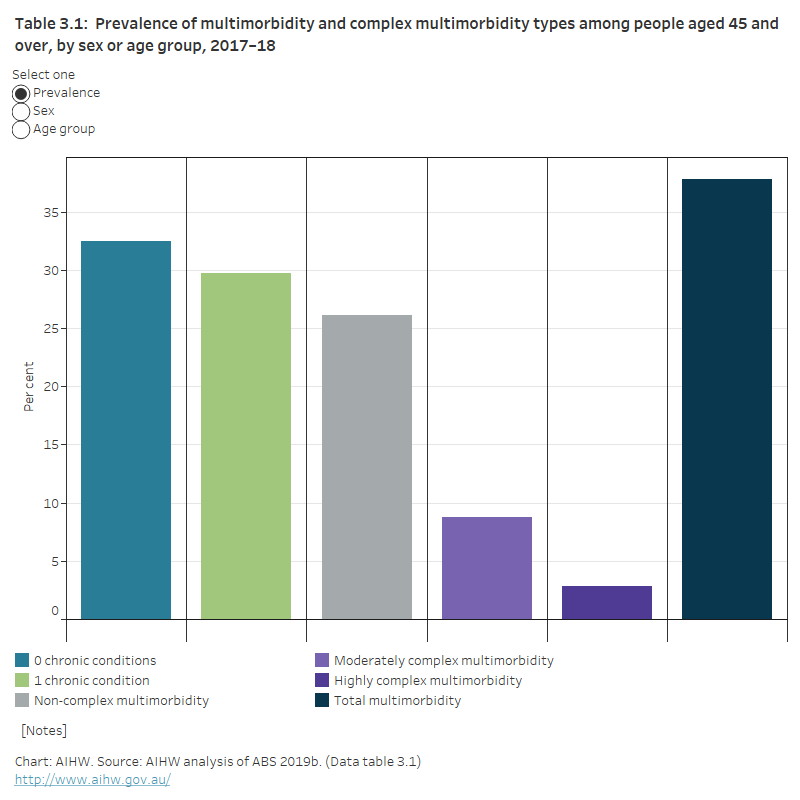
The prevalence of each multimorbidity type, by sex or age group is shown in Figure 3.1.
Figure 3.1: Prevalence of multimorbidity and complex multimorbidity types among people aged 45 and over, by sex or age group, 2017–18
This figure shows the proportion of people aged 45 and over with different multimorbidity types by sex or age group. Overall, women aged 45 and over were more likely to have multimorbidity (41%) compared with men (34%). Multimorbidity was more common in people aged 65 and over (51%) compared with people aged 45–64 (30%).