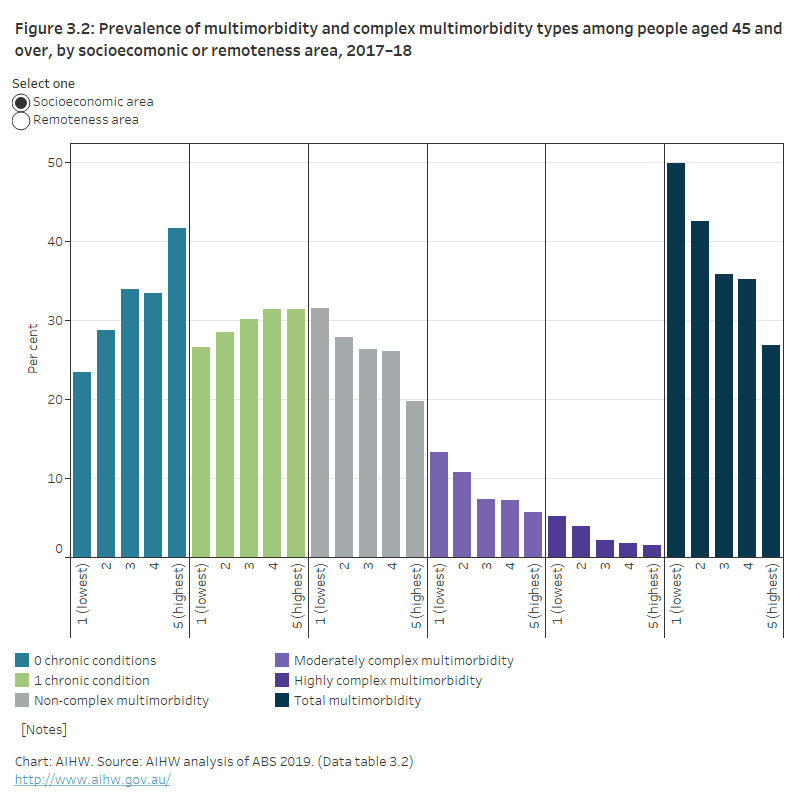
The prevalence of total multimorbidity, and of the different multimorbidity types, vary among population groups. Consistent with findings for people of all ages (see Does multimorbidity differ between population groups?), the prevalence of total multimorbidity among people aged 45 and over increased with increasing socioeconomic disadvantage, ranging from:
- 27% in the highest socioeconomic areas; to
- 50% in the lowest socioeconomic areas (Figure 3.2; Data table 3.2).
This reflects similar patterns in the prevalence of non-complex multimorbidity, moderately complex multimorbidity and highly complex multimorbidity which were all highest in the lowest socioeconomic areas:
- 32% of people in the lowest socioeconomic areas experienced non-complex multimorbidity, compared with 20% of people in the highest socioeconomic areas.
- 13% of people in the lowest socioeconomic areas had moderately complex multimorbidity, compared with 5.7% of people in the highest socioeconomic areas.
- 5.2% of people in the lowest socioeconomic areas had highly complex multimorbidity, compared with 1.5% of people in the highest socioeconomic areas.
There was less variation in the prevalence of total multimorbidity among people aged 45 and over across each of the remoteness areas (Major cities, Inner regional, Outer regional and Remote): ranging from 35% in Remote areas to 42% in Inner regional areas.
Prevalence of non-complex multimorbidity and total complex multimorbidity (including moderately and highly complex multimorbidity) across each of the remoteness areas was also similar. Based on the NHS 2017–18, it is estimated that among those aged 45 and over:
- non-complex multimorbidity affected 25–29% of people in each of the remoteness areas
- total complex multimorbidity (which includes moderately and highly complex multimorbidity) affected 10–14% of people in each of the remoteness areas.