Cost of dental care
People who can't afford a dentist
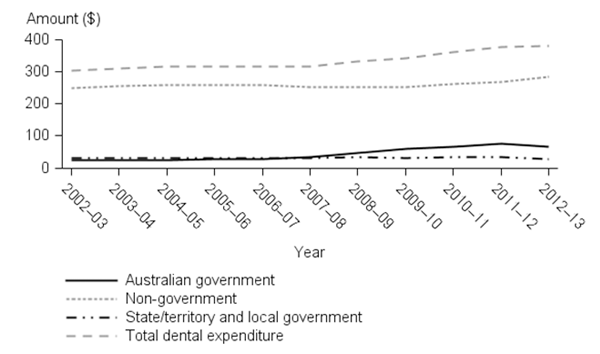
In 2013, survey data shows nearly a third of people aged 5 or older (32%) avoided or delayed visiting a dentist due to cost. This ranged from almost 11% of children aged 5–14 to 45% for adults aged 25–44.
From 1994 to 2013, there was an increase in the proportion of adults avoiding visits, from about 25% to 35%. For children, there was no overall change, although there was some year-to-year variation.
Figure 1: People avoiding dental visiting due to cost, 1994–2013
Source: National Dental Telephone Interview Survey 1994 to 2013.
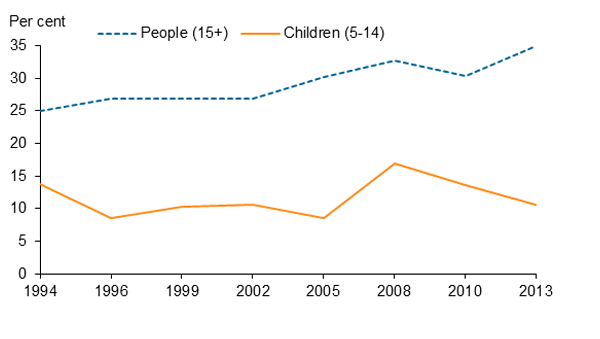
In 2013, cost prevented just over one-quarter of adults aged 25–64 from having their recommended treatment. Cost prevented only 6% of children aged 5–14 from having their recommended treatment.
Overall, for the period 1994 to 2010, the proportion of adults who had cost prevent their treatment fluctuated between 14% and 23%. For children, there was no overall change, fluctuating between 4% and 8% over the period.
Figure 2: Cost prevented recommended treatment, 1994–2013
Source: National Dental Telephone Interview Survey 1994 to 2013.
Dental insurance
In 2013 the National Dental Telephone Interview Survey found that, half of all people aged 5 and over (50.3%) had some level of dental insurance. The proportion of people with some dental insurance was higher in Major cities (53%) than in Inner regional and Outer regional areas (45% and 44%).
Over three-quarters of dentate adults in the highest household income group (78%) had some level of dental insurance. Less than one-third of adults in the bottom household income groups (ranging from 23%) had dental insurance.
The majority of adults with insurance reported that their insurance paid some (77%) or all (9%) of the dental costs of their last visit. About 10% of insured adults paid all their own dental expenses.
Almost one-fifth of insured adults (19%) who were required to cover their own dental expenses said it caused a large financial burden.
How much is spent on dental services?
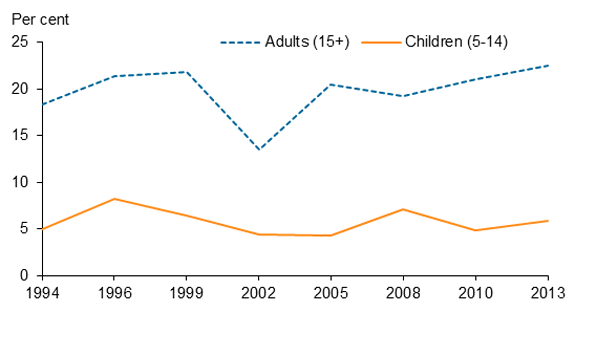
Recurrent expenditure on dental services in Australia (excluding hospitals) was $8,706 million in 2012–13, an increase from $5,945 million (adjusted for inflation) in 2008–09.
In 2012–13 the largest source of funds for dental expenditure was individuals, paying directly out-of-pocket for 58.2% of total dental costs. Health insurance funds provided a further 16.0%. Australian government premium rebates accounted for 7.0%, and other government contributions funded 18.3% of total expenditure (10.8% Australian government direct outlay and 7.5% from state and local governments).
In 2012–13, $380 was spent per capita, $284 of this by the non-government sector (mainly individuals).
Figure 3: Per capita expenditure on dental services, constant prices