Dental workforce
Who makes up the dental workforce?
In 2013 there were 15,479 registered dentists, of whom 88% where employed in their field. There were 1,195 dental prosthetists, 1,759 dental hygienists, 943 oral health therapists and 1,093 dental therapists registered. In each of the professions 85% or over were employed in their field.
Dental workforce
In 2013 there were about 56 dentists, 5 dental hygienists, 5 dental prosthetists, 3 dental therapists and 3 oral health therapists employed per 100,000 people.
The majority of employed dentists and prosthetists were men (62% and 86% respectively) while the majority of dental hygienists, dental therapists and oral health therapists were women (94%, 98% and 86% respectively).
Also in 2013, 23% of dentists were aged 55 or older. This compares to 34% of prosthetists and 28% of dental therapists. Dental hygienists and oral health therapists tended to be younger with just 7% and 3% aged 55 or older.
Most dentists were employed in Major cities (80.0% of all employed dentists), while only 0.9% were in Remote/Very remote areas. Major cities had the highest rates of all dental practitioners with the exception of dental therapists, where the highest rates were in Remote/Very remote areas.
Dental specialties
The largest group of dentists with specialist qualifications was orthodontists (535 or 38.0%). The majority of dental specialists were employed in Major cities (90.2%).
Figure 4: Employed dentists not working in the area of general dental practice, by specialty, 2013

Source: AIHW NHWDS 2013.
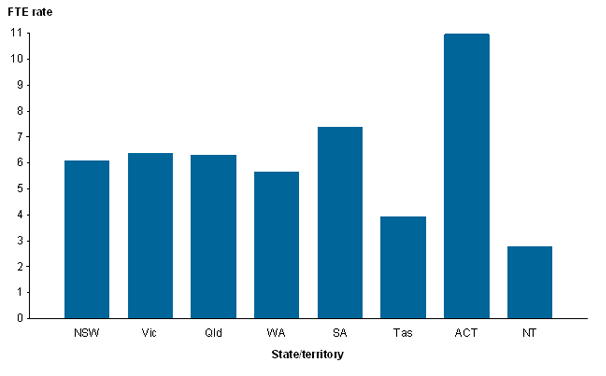
The jurisdiction with the highest FTE rate per 100,000 population for dental specialists was the Australian Capital Territory (11.0), and the lowest was the Northern Territory with an FTE rate of 2.8.
Figure 5: Employed dental specialists not working in the area of general dental practice
Notes
- Derived from state and territory of main job where available; otherwise, state and territory of principal practice is used as a proxy. If principal practice details are unavailable, state and territory of residence is used. Records with no information on all 3 locations are coded to ‘Not stated’.
- ‘Australia’ includes dental specialists who did not state or adequately describe their location and those who were overseas.
- FTE rate is per 100,000 population.
Source: AIHW NHWDS:2013