People with highest understanding of non-physical forms of violence
A high understanding that certain non-physical behaviours are a form of violence against women is one of many factors that can contribute to lower support for attitudes supportive of violence. Here 'highest understanding' is measured by examining the proportion of people whose score falls into the highest category on the Understanding Violence Against Women Scale (UVAWS).
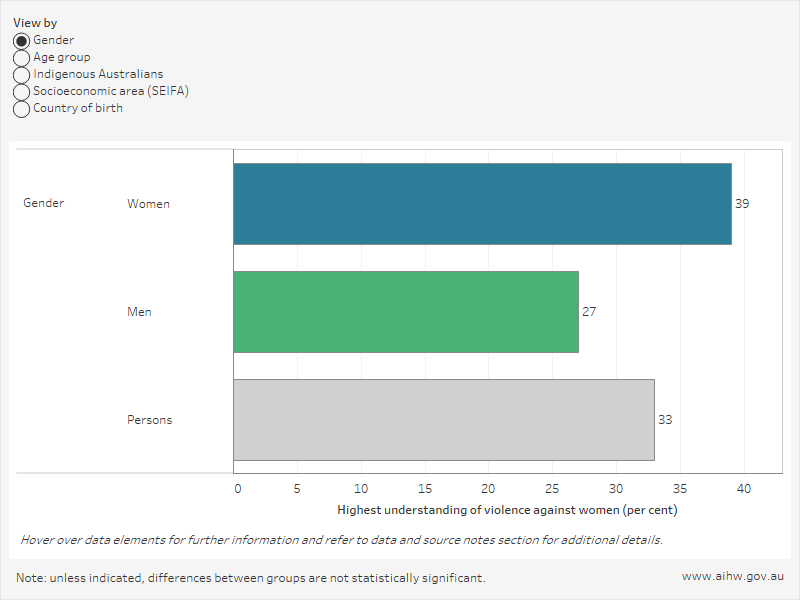
The visualisation below allows users to explore the relative differences in understanding of non-physical violence against women population groups. It shows that in 2017 a greater proportion of women than men were categorised as having the highest understanding of non-physical violence against women. Compared with all other age groups, a lower proportion of people aged 16–24 and 75 and over were categorised as having the highest understanding.
Proportion of people with highest understanding of non-physical violence against women, by population groups, 2017

Time series
Exploring changes in level of understanding of non-physical forms of violence over time can help to identify shifts in knowledge, and evaluate relevant primary prevention policies and programs. A higher mean score on the UVAWS indicates a higher level of understanding of violence against women and is desirable.
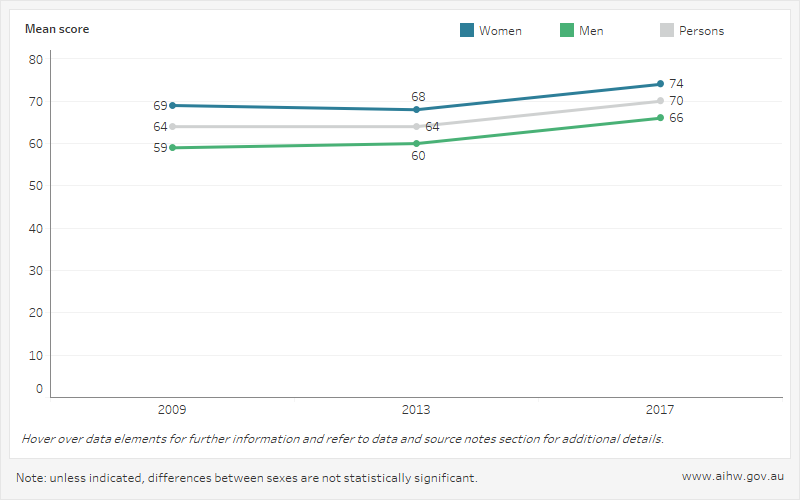
The visualisation below shows that between 2009 and 2017 there was a positive shift in understanding, for women and men.
Mean score on the Understanding Violence Against Women Scale (UVAWS), by gender, 2009, 2013 and 2017

Notes
- The Understanding of Violence Against Women Scale (UVAWS) is one of several composite measures included in the National Community Attitudes towards Violence against Women Survey (NCAS). The UVAWS is comprised of 6 items that ask participants whether they understand certain forms of non-physical violence, such as social, emotional, psychological and economic forms of control, abuse and exploitation, to be a form domestic violence or violence against women.
- The NCAS collects information from Australians aged 16 years and over.
- The data outlined in the first visualisation provides a comparison of the proportion of a particular population who fell into the quartile with the highest understanding of violence. Approximate quartiles were used in the reporting of the NCAS for the purpose of comparing different groups at a single point in time. The quartiles were calculated by taking the sample as a whole and dividing it into quartiles based on participant scores. The first quartile represents the lower scores, equating to lowest levels of understanding observed and the fourth quartile represents the highest scores, equating to highest levels of knowledge observed. The second and third quartiles were combined and labelled as a medium level of knowledge. After dividing the scores of the entire sample into quartiles, comparisons of particular populations can then be made by comparing what proportion of each population group sits in each quartile.
- The scores are relative and indicate whether one group has a relatively higher understanding than another group. However, the scores do not indicate the overall level of understanding of any group in an absolute sense, for example, it cannot be said that a group has a “good” or “bad” understanding.
- Non-main English speaking country includes respondents born overseas in a non-main English speaking country, that is, a country where the main language is not English.
- Mean scores on the UVAWS are reported here for the purposes of exploring changes to understanding over time. These data cannot be compared to the proportion of people with the highest level of understanding. Mean scores range from 0-100, with higher scores indicative of higher levels of understanding of violence against women.
- To determine whether differences in UVAWS scores between demographic groups within the sample represent genuine differences in the population, tests of statistical significance were conducted. Significance was tested at the 99 per cent confidence level (p≤.01). As the NCAS sample size is large, it is possible for a result to be statistically significant but too small to be of any practical importance. Thus, only results that are likely to have practical importance are noted as statistically significant, based on a Cohen’s effect size of > 0.2 (and p≤.01).
- For more information see Methods, Glossary and Data sources.
Sources
The National Community Attitudes towards Violence against Women Survey (NCAS) 2017
Next expected: 2021


