Impact on MBS service use
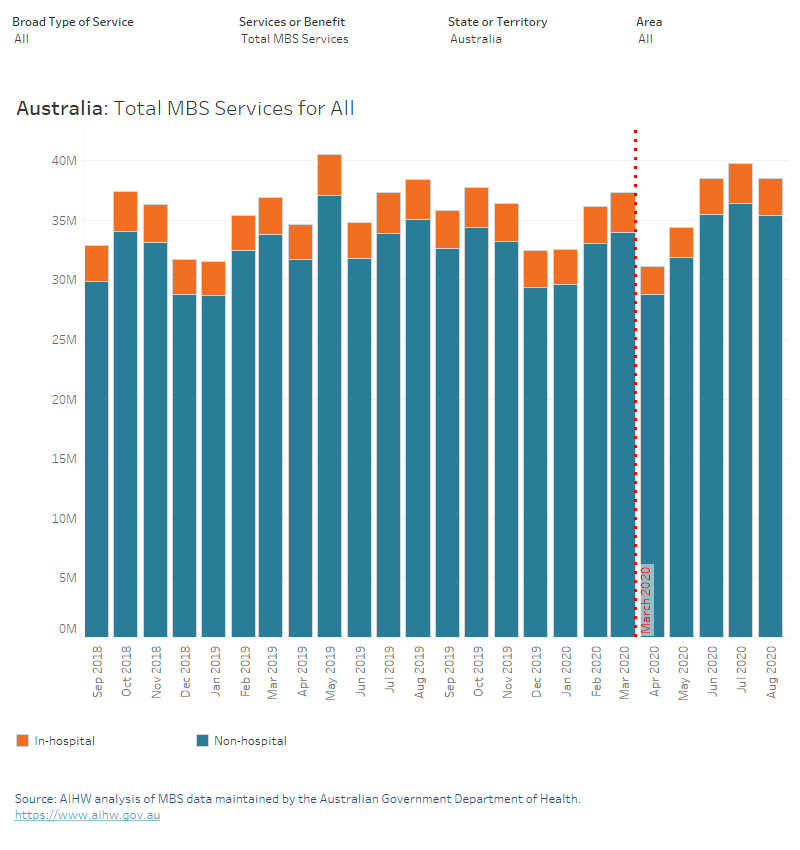
This bar chart presents MBS summary statistics for hospital and non-hospital services, by month of processing, from September 2018 to August 2020. Depending on selection, statistics can be presented on number of services by broad type of service group, and by region within state/territory. A vertical reference line shows the suspension of elective non-urgent surgery on the 26th of March 2020.
This bar chart presents MBS summary statistics for hospital and non-hospital services, by month of processing, from September 2018 to August 2020. Depending on selection, statistics can be presented on benefits paid by broad type of service group, and by region within state/territory. Suspension of elective non-urgent surgery was on the 26th of March 2020.

This line chart presents MBS summary statistics for the Broad Type of Service group ‘other MBS’ for hospital and non-hospital services, by month of processing, from September 2018 to August 2020. Depending on selection, statistics can be presented on benefits paid by broad type of service group, and by region within state/territory. Suspension of elective non-urgent surgery was on the 26th of March 2020.

This line chart presents MBS summary statistics for the Broad Type of Service group ‘optometry’ for hospital and non-hospital services, by month of processing, from September 2018 to August 2020. Depending on selection, statistics can be presented on benefits paid by broad type of service group, and by region within state/territory. Suspension of elective non-urgent surgery was on the 26th of March 2020.
This line chart presents MBS summary statistics for the Broad Type of Service group ‘pathology’ for hospital and non-hospital services, by month of processing, from September 2018 to August 2020. Depending on selection, statistics can be presented on benefits paid by broad type of service group, and by region within state/territory. Suspension of elective non-urgent surgery was on the 26th of March 2020.

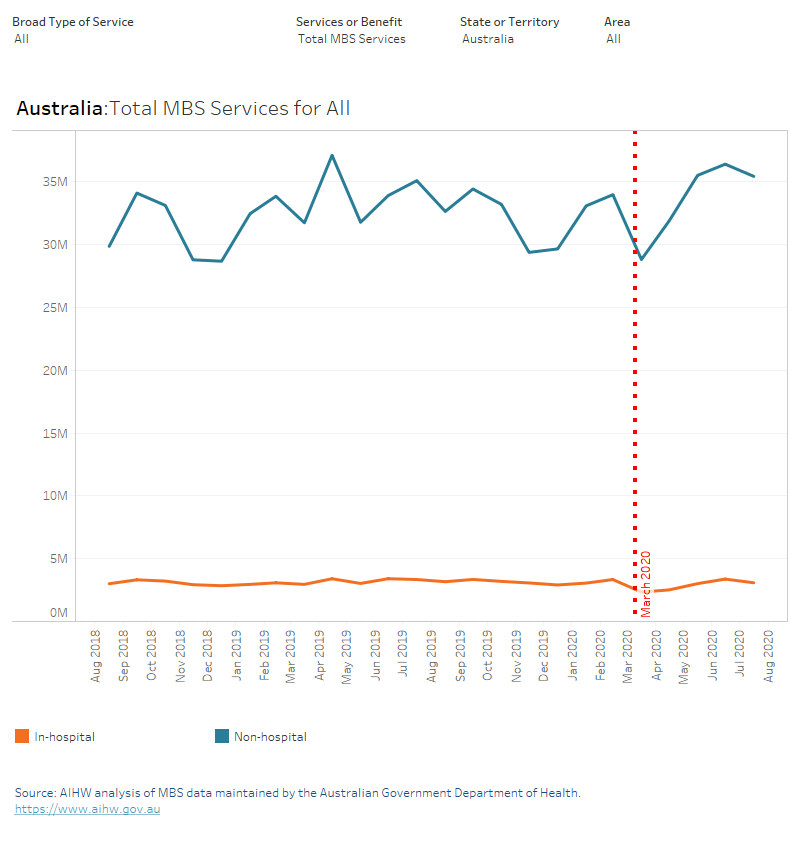
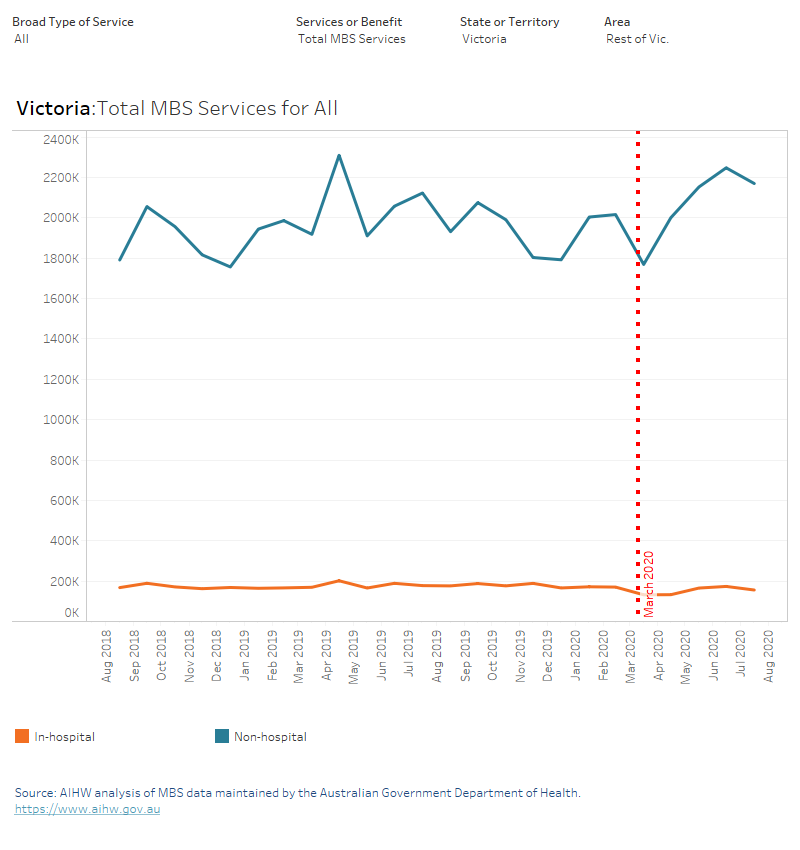
This line chart presents MBS summary statistics for hospital and non-hospital services, by month of processing, from September 2018 to August 2020. Depending on selection, statistics can be presented on number of services by broad type of service group, and by region within state/territory. A vertical reference line shows the suspension of elective non-urgent surgery on the 26th of March 2020.
This line chart presents MBS summary statistics for hospital and non-hospital services, by month of processing, from September 2018 to August 2020. Depending on selection, statistics can be presented on benefits paid by broad type of service group, and by region within state/territory. A vertical reference line shows the suspension of elective non-urgent surgery on the 26th of March 2020.

This line chart presents MBS summary statistics for the Broad Type of Service group ‘specialist attendances’ for hospital and non-hospital services, by month of processing, from September 2018 to August 2020. Depending on selection, statistics can be presented on benefits paid by broad type of service group, and by region within state/territory. Suspension of elective non-urgent surgery was on the 26th of March 2020.
This line chart presents MBS summary statistics for the Broad Type of Service group ‘operations’ for hospital and non-hospital services, by month of processing, from September 2018 to August 2020. Depending on selection, statistics can be presented on benefits paid by broad type of service group, and by region within state/territory. Suspension of elective non-urgent surgery was on the 26th of March 2020.
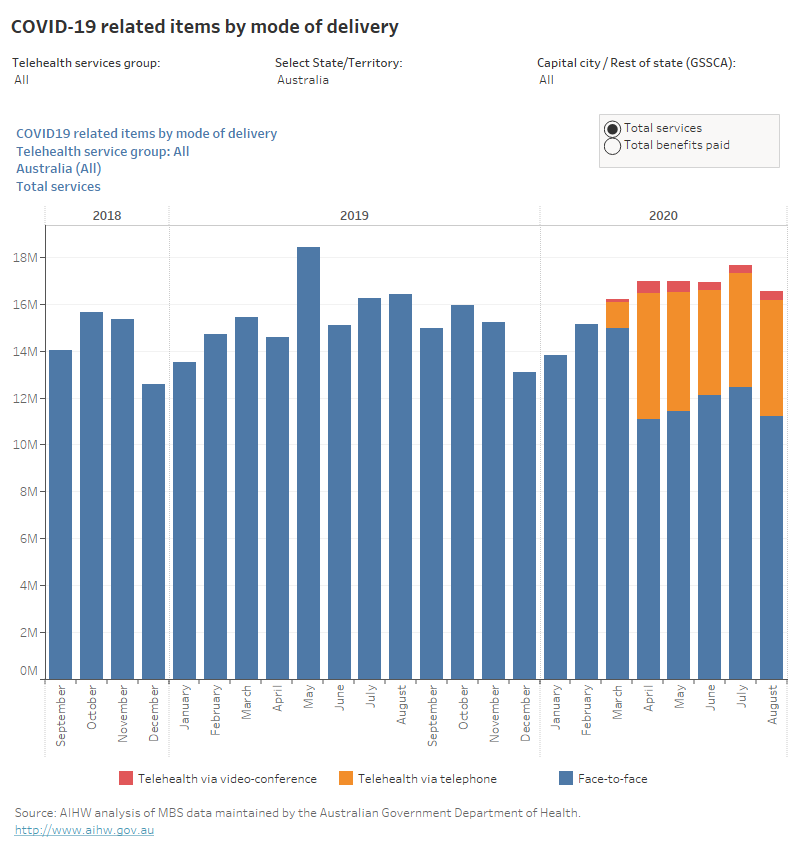
This bar chart presents the number of services and benefits paid for COVID-19 related items by mode of delivery (face-to-face, telehealth consultation via telephone, and telehealth consultation via video-conference) from September 2018 to August 2020.
This bar chart presents the number of services for COVID-19 related specialist attendance items by mode of delivery (face-to-face, telehealth consultation via telephone, and telehealth consultation via video-conference) from September 2018 to August 2020.

This bar chart presents the number of services for COVID-19 related obstetrics items by mode of delivery (face-to-face, telehealth consultation via telephone, and telehealth consultation via video-conference) from September 2018 to August 2020.

This bar chart presents the number of services for COVID-19 related allied health items by mode of delivery (face-to-face, telehealth consultation via telephone, and telehealth consultation via video-conference) from September 2018 to August 2020.

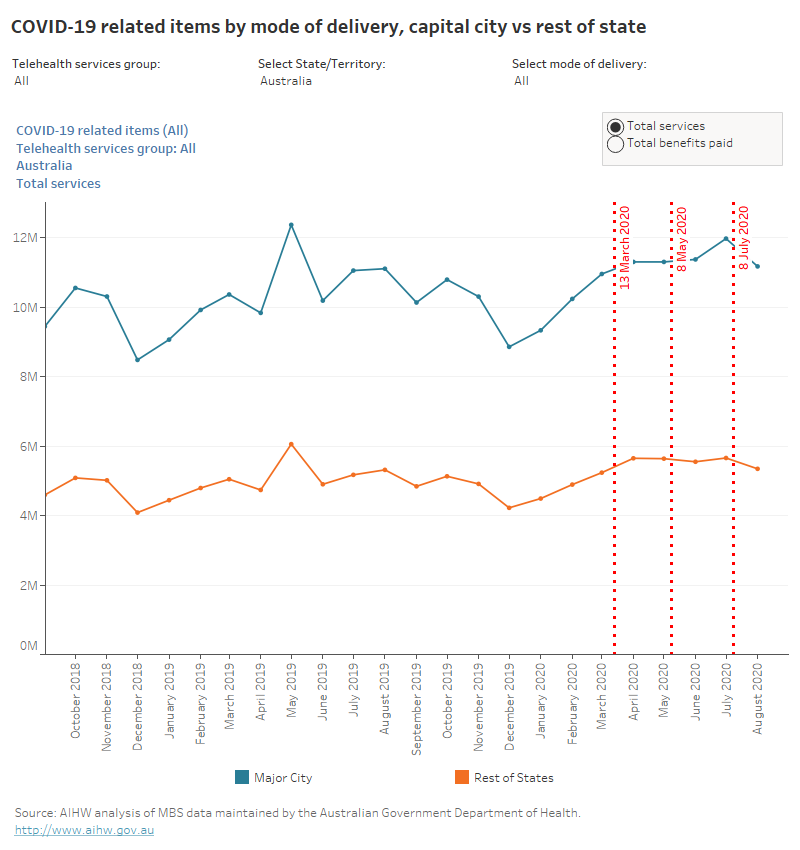
This line chart presents the capital city and rest of state’s number of services and benefits paid for COVID-19 related items by mode of delivery from September 2018 to August 2020.
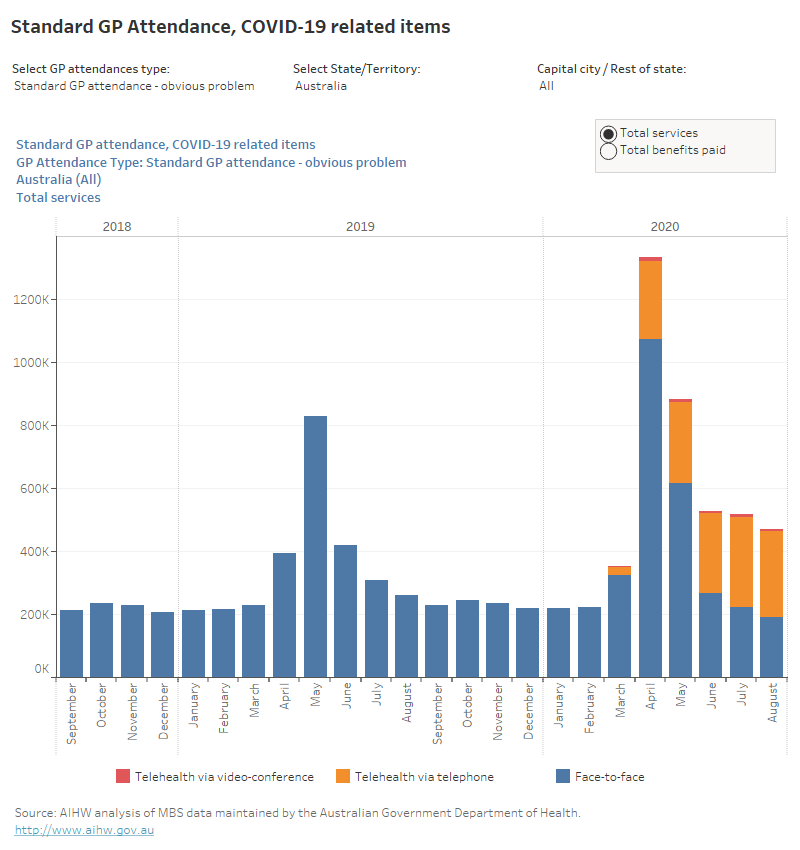
This bar chart presents the number of services and benefits paid for COVID-19 related items on the standard GP attendance category – obvious problem. The bar charts are presentable at the national level, state and territory level, and the capital city and rest of state level once the corresponding options are chosen. Time series range from September 2018 to August 2020.

This bar chart presents the number of services and benefits paid for COVID-19 related items on the standard GP attendance category – less than 20 minutes. The bar charts are presentable at the national level, state and territory level, and the capital city and rest of state level once the corresponding options are chosen. Time series range from September 2018 to August 2020.
This bar chart presents the number of services and benefits paid for COVID-19 related items on the standard GP attendance category – at least 20 minutes. The bar charts are presentable at the national level, state and territory level, and the capital city and rest of state level once the corresponding options are chosen. Time series range from September 2018 to August 2020.

This bar chart presents the number of services for COVID-19 and pre-existing bulk-billing incentives for un-referred services from September 2018 to August 2020.
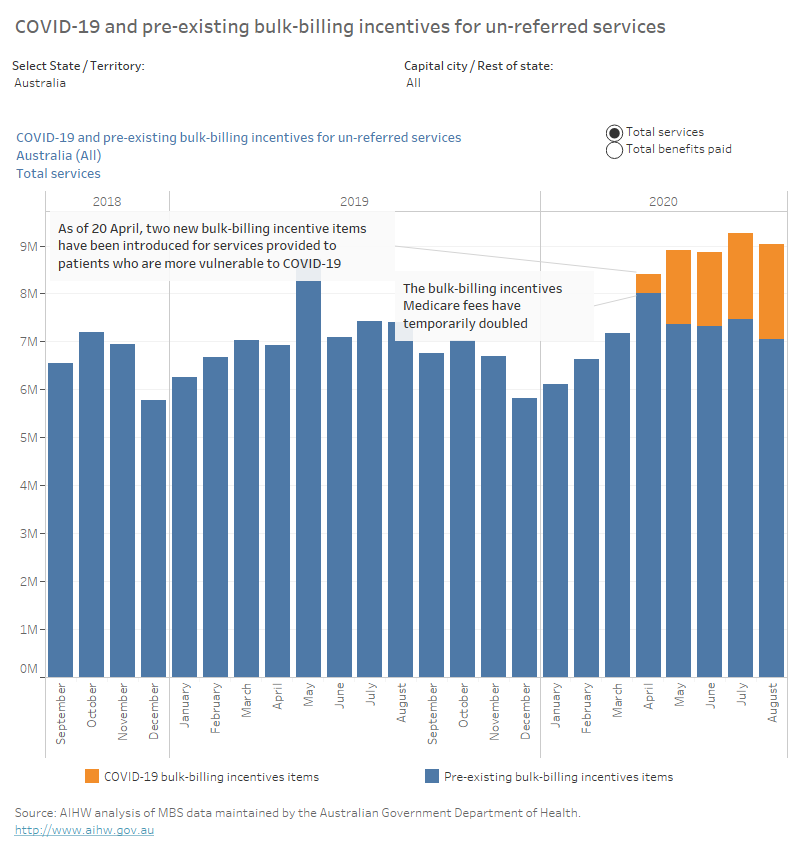
This bar chart presents the benefits paid for COVID-19 and pre-existing bulk-billing incentives for un-referred services from September 2018 to August 2020.
