Impact on PBS service use

What did the PBS data show?

This web report looks at the influence of COVID-19 on the Pharmaceutical Benefits Scheme (PBS) (including the Repatriation Schedule of Pharmaceutical Benefits (RPBS)) over the first eight months of 2020. The analysis compares the number of prescriptions dispensed and government benefits paid with the same period in the previous year.

Across the PBS, the total volume of scripts dispensed was similar in the 2019 and 2020 periods, with an increase of 0.6% in 2020. Over the past 7 years the yearly average growth in PBS script volumes was 1.5%, with the annual percent change ranging from -1.2% to 3%. This finding suggests that, to date, the COVID-19 pandemic has had minimal influence on overall script volumes for 2020.

There were other impacts during the period with changes in consumer behaviour coinciding with the introduction and then easing of restrictions. For example, there were unusually high volumes of scripts dispensed in March 2020, coinciding with the introduction of restrictions nationally, and this was followed by a decrease in April 2020. While it is difficult to directly measure the factors influencing health service use by the population, we can see the impacts on the PBS in the service use data. More detail on these impacts are provided below.

National COVID-19 measures related to medicines

In March 2020, the Australian Government implemented temporary changes to medicines regulation to support Australians’ continued access to PBS medicines in response to the COVID-19 pandemic. Some of these changes were in response to a dramatic increase in demand for medicines during early March, which resulted in pharmacies and wholesalers reporting medicine shortages (1).

The temporary measures included:

  • Recommended restrictions on the quantity of medicines purchased to prevent unnecessary medicine stockpiling. Pharmacists were required to limit dispensing of certain prescription medicines to a one-month supply.
  • Continued dispensing arrangements allow pharmacists to supply one month’s supply of a patient’s usual medicine without a prescription at the usual PBS consumer co-payment. Under usual Continued Dispensing arrangements, only certain oral contraceptives and lipid-lowering medicines (statins) can be supplied without a prescription. In response to the 2019–20 bushfire crisis, and then the COVID-19 pandemic, the Government temporarily expanded the range of PBS medicines that could be supplied under the Continued Dispensing (Emergency Measures). These temporary emergency arrangements will cease on 31 March 2021.
  • A home delivery service for PBS and RPBS medicines.
  • Digital image based prescriptions to support COVID-19-related telehealth medical services. Prescribers can now create a digital image of the patient’s prescription to support supply of their medicines. Pharmacists can dispense medications and make PBS claims from the digital image of the prescription sent through by the prescriber.
  • Serious Shortage Medicine Substitution Notices to allow medicine substitution by the pharmacist in the event of a shortage without prior approval from the prescribing doctor.

How many scripts were dispensed?

The following data visualisation shows the difference in the number of scripts dispensed (per cent), in January to August, 2019 and 2020, nationally:

  • Nationally, there was a 0.6% increase in the number of scripts dispensed for the first eight months of 2020 (203.8 million) compared to the equivalent period in 2019 (202.6 million).
  • In March, there was an increase of 23.1% in the number of scripts dispensed in 2020 (31.0 million), compared with 2019 (25.2 million). This spike was most significant for the group of medicines used to treat respiratory-related conditions such as asthma and chronic obstructive pulmonary disease (COPD).

How much in PBS benefits did the government pay?

The following data visualisation shows the total amount of government benefits paid, in January to August, 2019 and 2020 nationally through the PBS:

  • Nationally, there was a 7.5% increase in the amount of government benefits paid for the first 8 months of 2020 ($8.6 billion) compared to the equivalent period in 2019 ($8.0 billion).
  • In March, there was an increase of 22.1% in the amount of government benefits paid in 2020 ($1,205.3 million), compared with 2019 ($987.3 million).
  • The higher percentage increase of benefits paid in 2020 relative to the increase in the volume of scripts dispensed has been observed in previous periods. Over time spending through the PBS has generally risen faster than the volume of scripts. This could be related to the listing of new medicines on the PBS, which tend to have higher prices and/or have an initial high volume due to unmet demand. It could also be related to an increased proportion of patients with concessional status (due to changes in welfare status as a result of the COVID-19 pandemic), widening restrictions of PBS listed medicines, a change in treatment paradigms, and so forth. Further detailed analysis is required to fully understand the reasons for this disparity.

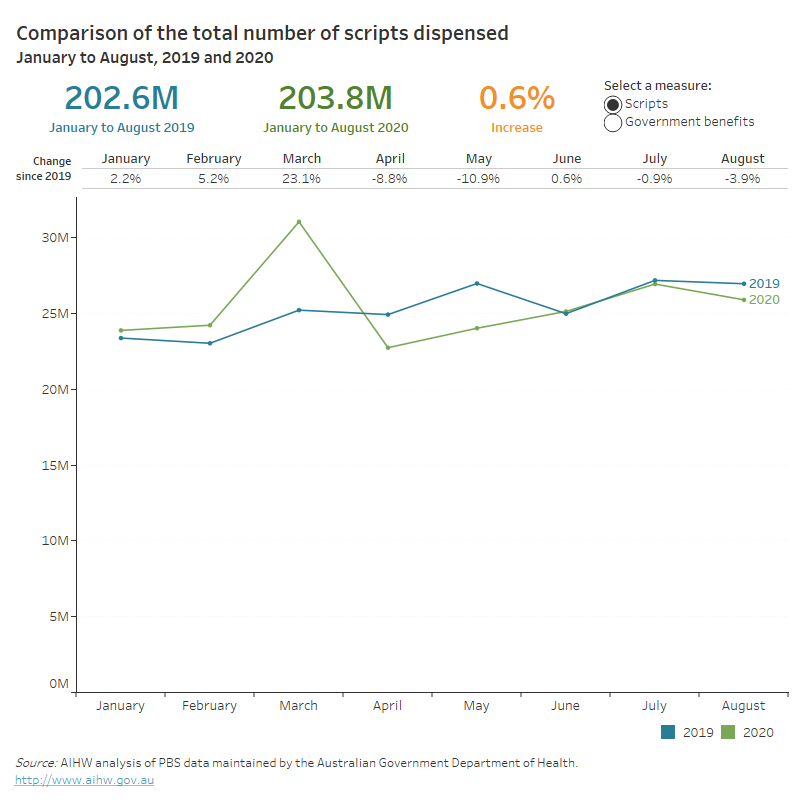
This line graph compares the monthly scripts dispensed and government benefits paid from January to August 2020 compared to the same period in 2019. Beyond the spike in script volume in March 2020 the monthly scripts for 2019 and 2020 followed a similar trajectory. Except for a slight drop in benefits paid in May 2020, the monthly benefits paid was higher than the same month in the previous year.

How did script dispensing vary by location?

Scripts dispensed are presented using greater capital city statistical areas as defined by the Australia Bureau of Statistics. Scripts were assigned to an area based on the patient's Medicare enrolment postcode which corresponds to most people’s residential address.

The following data visualisation shows the difference in the number of scripts dispensed (per cent), in January to August, 2019 and 2020, nationally and in each state and territory. States and territories are further split by greater capital cities and rest of state/territory areas:

  • The national pattern in 2020 shows an increase in the number of scripts dispensed in March, a decrease in April and May followed by a small percent change in June to August was broadly consistent across all states and territories.
  • This pattern was also broadly similar for greater capital cities and regional areas, however, the shifts between months were not as marked in the regional areas compared with the capital cities, with lower growth in March and lower declines in the following months.


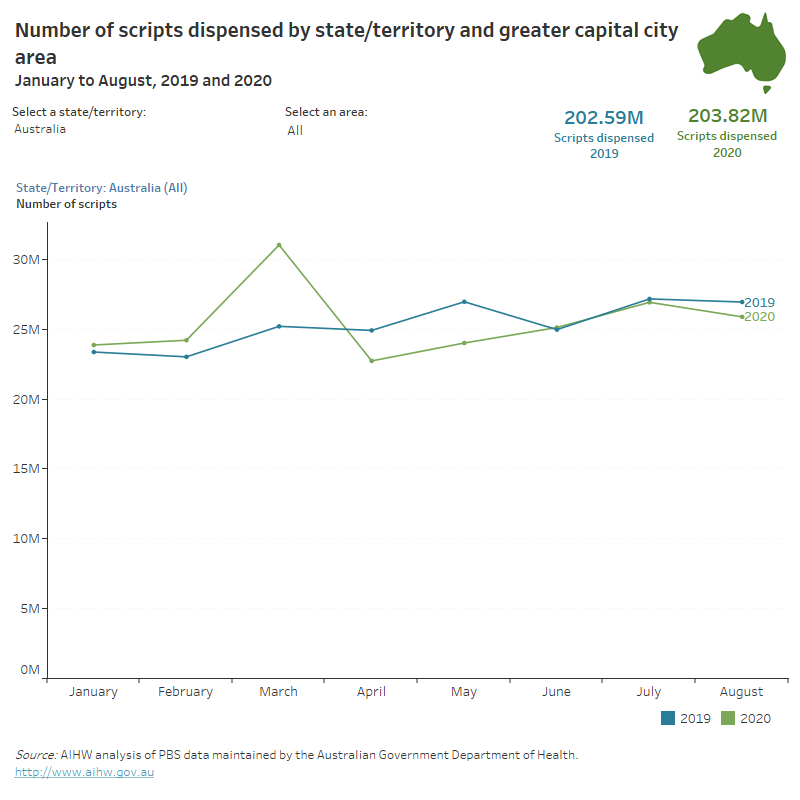
This visualisation presents monthly scripts dispensed graphically and as a table, in states/territories and greater capital city areas. The line graph shows that the national pattern of script volumes was generally consistent across the states/territories. The table and bar graph show the percent change comparing the same months in 2020 to 2019. Northern Territory had either the largest percent increase or the smallest percent decrease in a month

How did people get their medicines?

People obtain their medicines via an original (first time dispensing of a prescription) prescription or refill their medicines via a repeat (subsequent supply from an original prescription) prescription.

In response to the COVID-19 pandemic, from March 2020 the Australian Government introduced a range of temporary telehealth items in the MBS which allowed various medical practitioners to provide consultations either by telephone and/or videoconference. These changes included the introduction of digital image based prescriptions.

These temporary measures may have changed consumer behaviour. Original prescriptions may have decreased when telehealth was not feasible, and consumers may have chosen to avoid attending healthcare appointments.

The following data visualisation shows the number of scripts dispensed by original or repeat prescription, nationally and at state and territory levels from January to August, 2019 and 2020:

  • From January to August, 2019 and 2020, approximately 40% of scripts dispensed were original and 60% were repeats.
  • During March 2020, there was a 17.4% increase in the number of original scripts and a 27.3% increase in repeat scripts, compared to the same period in 2019. This change in consumer behaviour was likely due to stockpiling at the start of the pandemic.

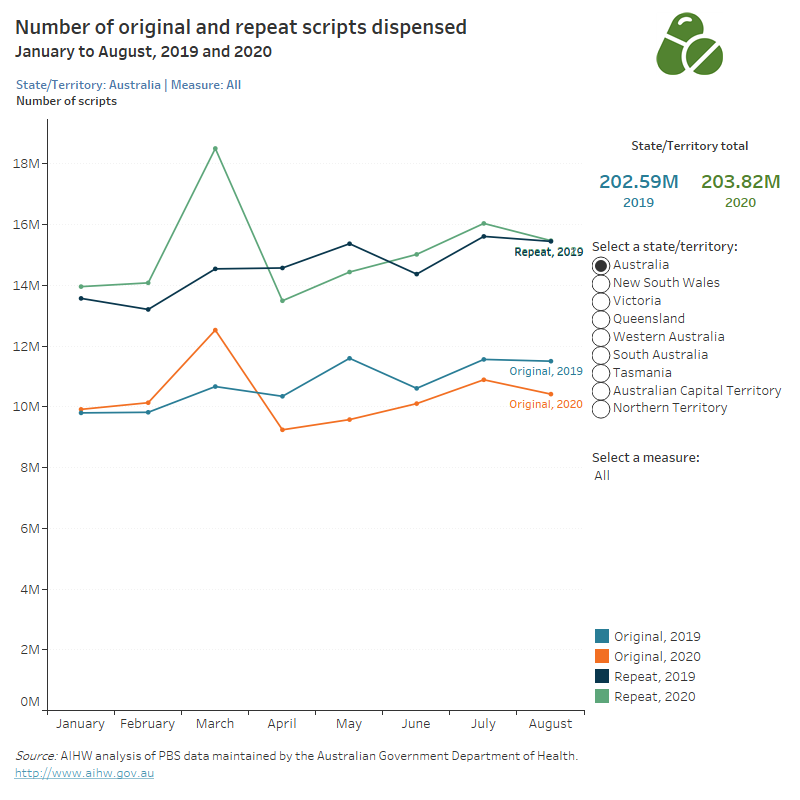
This visualisation presents monthly scripts dispensed from an original or a repeat prescription. The line graph shows a similar pattern over the 8 months for both types of scripts with repeat scripts (27.3%) having a greater percent increase in March 2020 from March 2019 compared to original scripts (17.4%).  The bar chart shows that following the consistent spike across all variables in March 2020, the percent change for repeat scripts moved into the positive while original scripts remained in the negative. All states and territories, except the Northern Territory, experienced a percent decrease in original scripts dispensed in April to August 2020 compared to the same period in 2019. The Northern Territory had a percent decrease in April and May 2020 then returned to a percent increase in June to August.         

How many original and repeat prescriptions were dispensed at the same time?

The PBS allows for original and repeat prescriptions to be supplied at the same time, in certain circumstances, according to Regulation 49 (previously Regulation 24). A common use of this rule is for people living or travelling to very remote areas within Australia or overseas. At the early stages of the pandemic there was significant concern around medication shortages and the risk of this option being overused.

The following data visualisation shows the number of scripts dispensed concurrently, nationally and at state and territory levels from January to August, 2019 and 2020:

  • Nationally, there was an increase in scripts dispensed concurrently (21.5%) in March 2020 compared to March 2019. This rapid rise coincided with the Australian Government Therapeutic Goods Administration advising about potential medicine shortages and the Department of Health requesting health practitioners limit this practice.
  • Nationally, there was a 72.0% decrease in the number of scripts dispensed concurrently in April 2020, compared to April 2019. This downward trend continued throughout the subsequent months in 2020.
  • Over the whole period, the number of scripts dispensed concurrently in 2020 was 0.6% of all scripts compared with 1.2% in the same period in 2019.

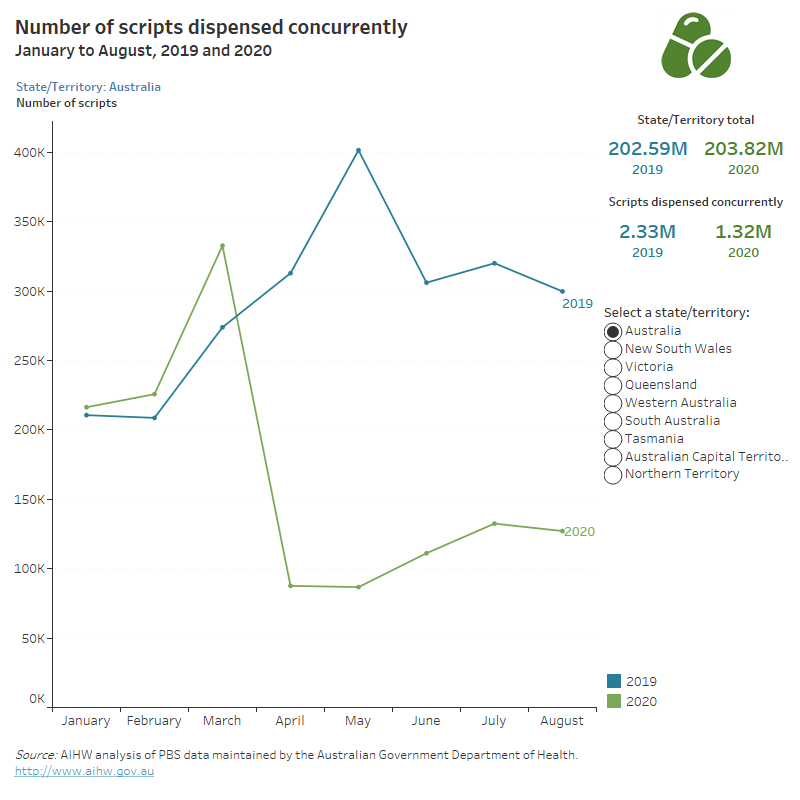
This visualisation presents monthly scripts dispensed where an original prescription and all repeats were dispensed all together. Comparing 2020 to 2019, all states and territories had a percent increase in March and percent decreases from April to August.

How did each PBS program contribute to medicine dispensing?

The majority of PBS medicines are prescribed by medical professionals and dispensed by community pharmacies. The PBS also provides specific schedules for other prescribers such as dentists and optometrists. There are also several programs funded under Section 100 of the National Health Act that provide alternative ways of providing medicine when the usual supply through community pharmacies is unsuitable. The largest of these are the Highly specialised drugs and Efficient funding of chemotherapy programs, both relate to medicines provided predominantly in tertiary care facilities such as hospitals, rather than in the community.

The following data visualisation shows the number of scripts dispensed by PBS programs, nationally and at state and territory levels from January to August, 2019 and 2020. Some specific effects included:

  • The temporary suspension of non-urgent elective surgeries effective from 26 March 2020, affected a number of services such as in-vitro fertilisation. In April, there was a 57.7% decrease in the number of scripts dispensed for in-vitro fertilisation, compared to April 2019. There were subsequent increases from June onwards.
  • Due to the national measures introduced to limit the spread of COVID-19, there were concerns that patients on chemotherapy would choose not to access their treatments to avoid the risk of being infected by COVID-19. However this was not evident in the data. Nationally, prescriptions within the S100 efficient funding of chemotherapy showed an increase in script volumes that was consistent with long term trends, rather than the suspected decrease.

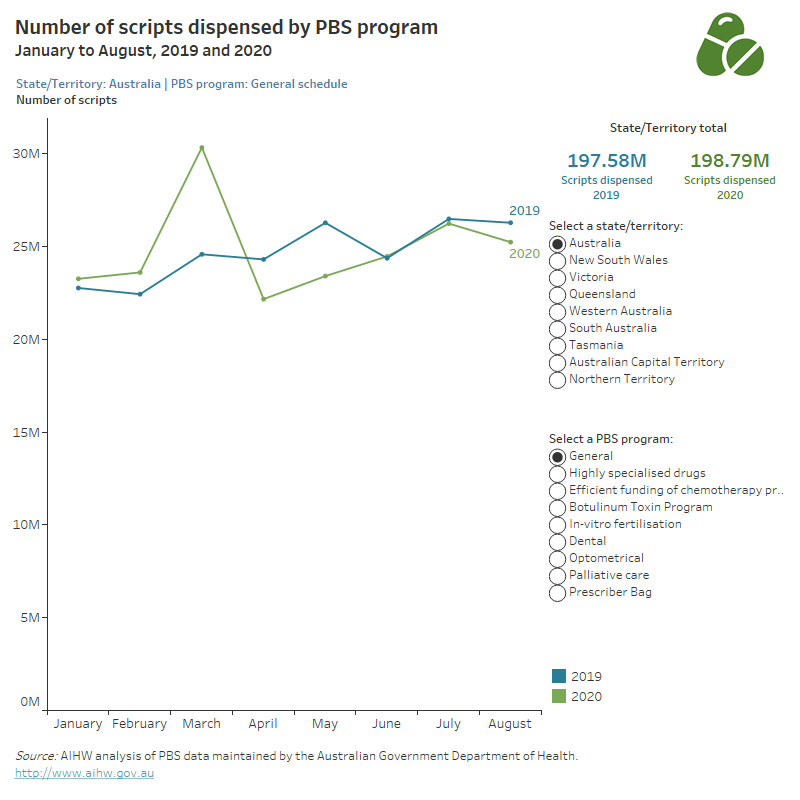
This visualisation presents monthly scripts dispensed according to PBS programs which include; general, palliative care, dental, optometrical, prescriber bag, highly specialised drugs, efficient funding of chemotherapy, in-vitro fertilisation and botulinum toxin programs. The dental schedule had a large percent decrease of 17.1% in April 2020 and 11.6% in May, compared to the same months in 2019. This was due to suspension of non-urgent health services.

What medicines did people have dispensed?

The Anatomical Therapeutic Classification (ATC) groups have been used to show the impact of COVID-19 on medicine utilisation. The ATC is a classification system for medicines and is defined by the World Health Organisation.

The following data visualisation shows the number of scripts dispensed by ATC groups, nationally and at state and territory levels from January to August, 2019 and 2020:

  • Nationally, there was an 87.4% increase in the number of scripts dispensed for respiratory system medicines in March 2020 compared to the corresponding period in 2019. This increase was largely driven by the group of medicines used to treat respiratory related conditions such as asthma and chronic obstructive pulmonary disease (COPD).
  • Nationally, there was a significant decrease in scripts dispensed for anti-infectives (this group consists predominantly of antibiotics and antivirals) from 2.5 million in March 2020 to 1.5 million in April. This downward trend carried through to August 2020 compared to the same months in 2019. This decrease in antimicrobial utilisation could be associated with COVID-19 measures such as physical distancing and improved hand hygiene practices. This corresponds with reports of lower numbers of influenza cases in Australia compared to previous years.

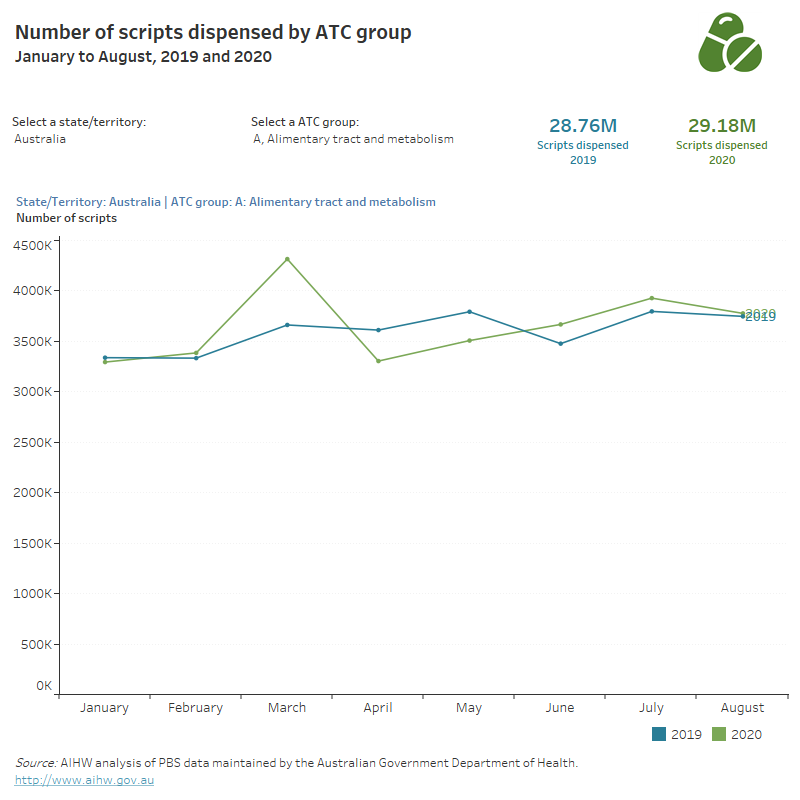
This visualisation presents monthly scripts dispensed graphically and as a table, according to ATC groups such as cardiovascular system, nervous system, sensory organs. Among the ATC groups, respiratory system had the largest percent increase of 10.7% over the 8 months in 2020 compared to the same period in 2019. Anti-infective for systemic use had the largest percent decrease of 21.8%.

Where do I go for more information?

For more information on medicines in the health system, see: