Clients with a current mental health issue
According to the most recent national Survey of Mental Health and Wellbeing, in 2007, 1 in 5 (20%) Australians (aged 16–85) had a current mental health issue, while 45% of Australians reported having had a mental disorder at some point in their life (ABS 2008). The intertwined nature of mental health issues and homelessness is well established (Kalevald et al. 2018). People with mental health issues are a group who are particularly vulnerable to homelessness. Research has shown that experiences of homelessness can trigger, exacerbate and magnify mental health issues (see for example, Kalevald et al. 2018, Brackertz et al 2018, CHP 2018 and Johnson & Chamberlain 2011). People living with a mental illness can be isolated, have disrupted family and social networks and sometimes suffer poor physical health, all of which impact their capacity to find and maintain adequate housing. Further, symptoms such as hallucinations, compulsive behaviours and anxiety can make it difficult to seek and maintain employment (Robinson 2003).
People experiencing homelessness with mental health issues need the support of various services including housing, but navigating through these services can be particularly challenging. Several studies suggest that when people with mental health issues are supported by homelessness agencies, they are more likely to remain housed rather than become homeless (MHCA 2009, Du et al. 2013, Wood et al. 2016, ABS 2014).
Key findings
- In 2018–19, there were 86,500 SHS clients reporting a current mental health issue, a 7% increase from the previous year.
- Not only were clients with a current mental health issue one of the largest SHS client groups (30% of all SHS clients), they were also one of the fastest growing client groups (increasing by 38% in the 5 years to 2018–19).
- Over half of all SHS clients with a current mental health issue were known to be housed, but at risk of homelessness (52%) when they sought SHS support, and most were returning clients (66%), have previously been assisted by a SHS agency at some point since the collection began in 2011–12.
- It was more common for clients with a current mental health issue to present to SHS agencies living alone (46%) than in family units or groups.
- At the end of SHS support, fewer clients with a current mental health issue were homeless (36%, down from 48%); with 3,200 fewer clients sleeping rough (decreasing from 7,500 to almost 4,300 clients).
Reporting clients with a mental health issue in the Specialist Homelessness Services Collection (SHSC)
Specialist Homelessness Services (SHS) clients are identified as having a current mental health issue if they are aged 10 years or older and have provided any of the following information:
- They indicated that at the beginning of support they were receiving services or assistance for their mental health issues or had in the last 12 months.
- Their formal referral source to the SHS was a mental health service.
- They reported ‘mental health issues’ as a reason for seeking assistance.
- Their dwelling type either a week before presenting to an agency, or when presenting to an agency, was a psychiatric hospital or unit.
- They had been in a psychiatric hospital or unit in the last 12 months.
- At some stage during their support period, a need was identified for psychological services, psychiatric services or mental health services.
Client characteristics
Of the 290,300 SHS clients accessing services in 2018–19, 86,500 (30%) clients reported a current mental health issue. The number and proportion of clients presenting with a current mental health issue has been increasing since the beginning of the SHSC in 2011–12. Various factors, including increased identification, community awareness and reduced stigma, may have had an impact on the increase in self-identification and reporting of mental illness among SHS clients. In 2018–19 (Table MH.1):
- Clients with a current mental health issue were one of the fastest growing client groups within the SHSC, growing by 38% since 2014–15. Between 2017–18 and 2018–19 the increase was 7%, a larger increase than in the previous period.
- The rate of clients with a current mental health issue has increased from 27 clients per 10,000 population in 2014–15 to 35 in 2018–19.
|
|
2014–15 |
2015–16 |
2016–17 |
2017–18 | 2018–19 |
|---|---|---|---|---|---|
|
Number of clients |
62,904 |
72,120 |
77,286 |
81,004 | 86,499 |
|
Proportion of all clients |
25 |
26 |
27 |
28 | 30 |
|
Rate (per 10,000 population) |
26.8 |
30.3 |
31.9 |
32.9 | 34.6 |
|
Housing situation at the beginning of the first support period (proportion (per cent) of all clients) |
|||||
|
Homeless |
50 |
50 |
50 |
48 | 48 |
|
At risk of homelessness |
50 |
50 |
50 |
52 | 52 |
|
Length of support (median number of days) |
62 |
64 |
68 |
72 | 75 |
|
Average number of support periods per client |
2.3 |
2.3 |
2.4 |
2.4 | 2.4 |
|
Proportion receiving accommodation |
42 |
39 |
37 |
37 | 36 |
|
Median number of nights accommodated |
44 |
44 |
45 |
43 | 39 |
|
Proportion of a client group with a case management plan |
70 |
70 |
71 |
72 | 72 |
|
Achievement of all case management goals (per cent) |
19 |
17 |
18 |
19 | 19 |
Notes:
- Rates are crude rates based on the Australian estimated resident population (ERP) at 30 June of the reference year. Minor adjustments in rates may occur between publications reflecting revision of the estimated resident population by the Australian Bureau of Statistics.
- The denominator for the proportion receiving accommodation is all SHS clients who have a current mental health issue. Denominator values for proportions are provided in the relevant supplementary table.
- The denominator for the proportion achieving all case management goals is the number of client groups with a case management plan. Denominator values for proportions are provided in the relevant supplementary table.
- Data for 2014–15 to 2016–17 have been adjusted for non-response. Due to improvements in the rates of agency participation and SLK validity, data from 2017–18 are not weighted. The removal of weighting does not constitute a break in time series and weighted data from 2014–15 to 2016–17 are comparable with unweighted data for 2017–18 onwards. For further information, please refer to the Technical Notes.
- In 2017–18, age and age-related variables were derived using a more robust calculation method. Data for previous years have been updated with the improved calculation method for age. As such, data prior to 2017–18 contained in the SHS Annual Report may not match that contained in the SHS Annual Report Historical Tables.
Source: Specialist Homelessness Services Collection 2014–15 to 2018–19.
Age and sex
In 2018–19, of those clients presenting with a current mental health issue (Supplementary table MH.1):
- There were more female (more than 52,300 clients or 60%) than male SHS clients (almost 34,200 or 40%), similar to the proportions in 2017–18.
- Males had an older age profile than females, with 28% (9,400 clients) of males aged over 45, compared with 22% (11,500 clients) of females.
- Over half (53%) were aged 10–34 years, higher than all SHS clients (45%). A further 23% were aged 35–44 (compared with 18% of all SHS clients) and 24% were over 45 (compared with 20% of all SHS clients).
Indigenous clients
In 2018–19, around 83,200 SHS clients with a current mental health issue reported their Aboriginal and Torres Strait Islander status (Supplementary table MH.8). Key findings for this group include:
- Around 1 in 5 (19%) of all clients with a current mental health issue were Indigenous.
- Around one-quarter (23% or 16,100 clients) of all 68,900 Indigenous SHS clients had a current mental health issue.
- Almost 2 in 3 (64%) Indigenous clients with a current mental health issue were female, and 36% were male.
- Around 4 in 10 (38%) Indigenous SHS clients with a current mental health issue were aged 10–24 years, a further 45% were aged 25–44 and 18% were aged over 45.
States and territory and remoteness
There were differences across the states and territories in the rates of clients presenting to SHS agencies with a current mental health issue. In 2018–19:
- SHS agencies based in Victoria reported the greatest number of clients (almost 34,500 clients) and the second highest rate of clients with a current mental health issue (53 clients per 10,000 population). Tasmania had the highest rate, with 60 clients per 10,000 population (Supplementary table MH.2).
- Around half (48%) of Tasmania’s SHS clients reported a current mental health issue, along with 40% of clients in the Australian Capital Territory and 34% in New South Wales. By contrast, 11% of the SHS clients in the Northern Territory reported a current mental health issue (Supplementary tables MH.2 and CLIENTS.1).
- Almost 2 in 3 clients (65%) with a current mental health issue accessed SHS in Major cities. A further 26% accessed services in Inner regional areas and 8% in Outer regional areas (Supplementary table MH.10).
Selected vulnerabilities
In 2018–19, of the 86,500 SHS clients who had a current mental health issue, over half (54% or 46,600 clients) were experiencing additional selected vulnerabilities (Table MH.2):
- 3 in 10 clients (30% or 26,300 clients) also experienced family and domestic violence.
- 14% (12,000 clients) of clients also reported problematic drug and/or alcohol use.
- A further 1 in 10 (10% or almost 8,400 clients) experienced all 3 selected vulnerabilities: family and domestic violence, problematic drug and/or alcohol use and a current mental health issue.
These figures provide an insight into the multiple disadvantages clients experiencing mental health issues face and highlight the value of an integrated service response to homelessness for these clients (Flatau et al. 2013).
|
Family and domestic violence |
Mental health issue |
Problematic drug |
Clients |
Per cent |
|---|---|---|---|---|
|
Yes |
Yes |
Yes |
8,351 |
9.7 |
|
Yes |
Yes |
No |
26,279 |
30.4 |
|
No |
Yes |
Yes |
11,951 |
13.8 |
|
No |
Yes |
No |
39,918 | 46.1 |
| 86,499 | 100.0 |
Notes:
- Clients are assigned to one category only based on their vulnerability profile.
- Clients are aged 10 and over.
- Totals may not sum due to rounding.
Source: Specialist Homelessness Services Collection 2018–19.
Living arrangements
At the beginning of support, clients with a current mental health issue (aged over 10) were more likely to be living alone (38,700 clients or 46%) or as a lone parent with child(ren) (20,700 clients or 25%) rather than in a group (6,600 clients or 8%) or as a couple with child(ren) (6,300 or 7%) (Supplementary table MH.9).
Service use patterns
Service use patterns for clients with a current mental health issue have changed between 2014–15 and 2018–19 (Table MH.1).
- There were increases in the median number of days of support, from 62 days in 2014–15 to 75 days in 2018–19.
- The proportion of clients receiving accommodation decreased (from 42% to 36%), along with the median number of nights accommodated (from 44 to 39 nights per client).
New or returning clients
In 2018–19 of those clients presenting with a current mental health issue (Supplementary table MH.7):
- Most (66% or more than 57,400 clients) were returning clients, that is, they had previously received assistance from a SHS agency at some point since the collection began in 2011–12.
- One-third (34% or almost 29,100 clients) of those with a current mental health issue were new to SHS agencies, having not previously received services.
Main reasons for seeking assistance
In 2018–19, the most common main reasons for seeking SHS assistance for clients with a current mental health issue were (Supplementary tables MH.5 and MH.6):
- housing crisis (22% or more than 18,700 clients)
- family and domestic violence (20% or 16,800 clients)
- inadequate or inappropriate dwelling conditions (12% or almost 10,300 clients).
There were differences in the main reasons for those clients with a current mental health issue presenting at risk of, or experiencing homelessness:
- For clients at risk of homelessness, family and domestic violence (24%) was the most common main reason, followed by housing crisis (18%).
- For clients experiencing homelessness, housing crisis (26%) was the most common main reason, followed by inadequate or inappropriate dwelling conditions (18%).
Services needed and provided
Figure MH.1 illustrates the top 6 most needed services for clients with a current mental health issue in 2018–19. Four of these were related to accommodation:
- long-term housing was the most needed service (more than 44,500 clients or 52%) yet least provided (4% of these clients were provided this assistance). A further 11,900 clients (27%) in need of long-term housing were referred to another agency. Almost 30,900 clients in need were neither provided nor referred.
- short-term or emergency accommodation was needed by 41,600 clients (48%), with 6 in 10 (58%) of these clients receiving this assistance.
- assistance to sustain tenancy/prevent eviction was needed by almost 37,400 clients with a current mental health issue, and a comparatively high proportion were provided with this service (82%).
- medium-term/transitional housing was needed by 35,700 clients (41%) and 24% of these clients were provided this assistance. Similar to long-term housing, this type of accommodation was commonly referred (18% or almost 6,500 clients).
The other 2 most needed services by clients with a current mental health issue were related to financial security:
- material aid/brokerage was needed by 41,400 clients (48%) and provided to almost 35,900 clients (87%).
- financial information was needed by 32,000 clients (37%) and provided to 26,800 clients (84%).
Over 1 in 4 (27% or 23,600) clients with a current mental health issue identified a need for mental health-based services. Specifically:
- 24% (more than 20,600 clients) identified a need for mental health services with 44% of these requests met.
- 11% (almost 9,100 clients) identified a need for psychological services with 34% of these requests met.
- 6% (more than 5,500 clients) identified a need for psychiatric services with 35% of these requests met.
Figure MH.1: Clients with a current mental health issue, by most needed services and service provision status (top 6), 2018–19
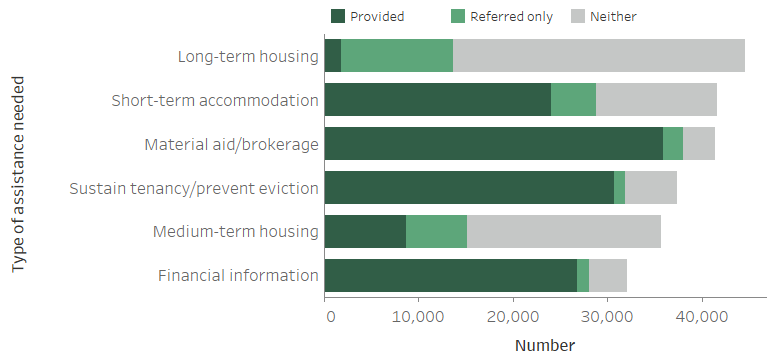
Notes:
- Excludes ‘Other basic assistance’, ‘Advice/information’ and ‘Advocacy/liaison on behalf of client’.
- 'Short-term accommodation' includes temporary and emergency accommodation and sustain tenancy/prevent eviction includes assistance to sustain tenancy or prevent tenancy failure or eviction.
- 'Neither' indicates a service was neither provided nor referred.
Source: Specialist Homelessness Services Collection 2018–19, Supplementary table MH.3.
Outcomes at the end of support
Outcomes presented here describe the change in client’s housing situation between the start and end of support. Data is limited to clients who ceased receiving support during the financial year—meaning that their support periods had closed and they did not have ongoing support at the end of the year.
Many clients had long periods of support or even multiple support periods during 2018–19. They may have had a number of changes in their housing situation over the course of their support. These changes within the year are not reflected in the data presented here, rather the client situation at the start of their first support period in 2018–19 is compared with the end of their last support period in 2018–19. A proportion of these clients may have sought assistance prior to 2018–19, and may again in the future.
In 2018–19, for clients with a current mental health issue (Table MH.3):
- The proportion of clients known to be experiencing homelessness decreased from just under half (48%) at the start of support to 36% at the end of support; this equates to almost 7,200 fewer clients experiencing homelessness.
- While there was little change in the proportion of clients in short term temporary accommodation (around 16% at both the start and end), considerably fewer clients were ‘rough sleeping’ (from 13% to 8%) and ‘couch surfing’ (from 18% to 13%) following SHS support.
- One of the largest changes was the increase in the number of clients living in public or community housing (renter or rent free); increasing by almost 3,900 clients from the start to the end of SHS support (from 6,300 to 10,100 clients).
These trends demonstrate that by the end of SHS support, fewer clients with a current mental health issue were known to be experiencing homelessness, and most (64%) were living in housing, be it public or community, private or other housing or an institutional setting.
|
Housing situation |
Beginning of support |
End of |
Beginning of support |
End of |
|---|---|---|---|---|
|
No shelter or improvised/inadequate dwelling
|
7,503 | 4,260 | 13.3 | 7.8 |
| Short term temporary accommodation | 9,207 | 8,675 | 16.3 | 16.0 |
|
House, townhouse or flat - couch surfer or with no tenure |
10,273 |
6,874 |
18.2 |
12.6 |
| Total homeless | 26,983 | 19,809 | 47.7 | 36.4 |
|
Public or community housing - renter or rent free |
6,259 |
10,138 |
11.1 |
18.6 |
|
Private or other housing - renter, rent free or owner |
19,503 |
21,740 |
34.5 |
40.0 |
|
Institutional settings |
3,845 |
2,695 |
6.8 |
5.0 |
|
Total at risk |
29,607 |
34,573 |
52.3 |
63.6 |
| Total clients with known housing situation | 56,590 | 54,382 | 100.0 | 100.0 |
| Not stated/other | 4,558 | 6,766 | ||
|
Total clients |
61,148 |
61,148 |
|
|
Notes:
- Percentages have been calculated using total number of clients as the denominator (less not stated/other).
- It is important to note that individual clients beginning support in one housing type need not necessarily be the same individuals ending support in that housing type.
- Not stated/other includes those clients whose housing situation at either the beginning or end of support was unknown.
Source: Specialist Homelessness Services Collection. Supplementary table MH.4.
Housing outcomes for homeless versus at risk clients
For clients with a known housing status who were at risk of homelessness at the start of support (almost 27,700 clients), by the end of support (Figure MH.2):
- Most (15,400 clients or 56%) were in private housing
- Around 6,300 clients (23%) were in public or community housing.
A smaller number were experiencing homelessness at the end of support (around 4,000 clients or 15% of those who started support at risk).
Figure MH.2: Housing situation for clients with closed support who began support at risk of homelessness, 2018–19
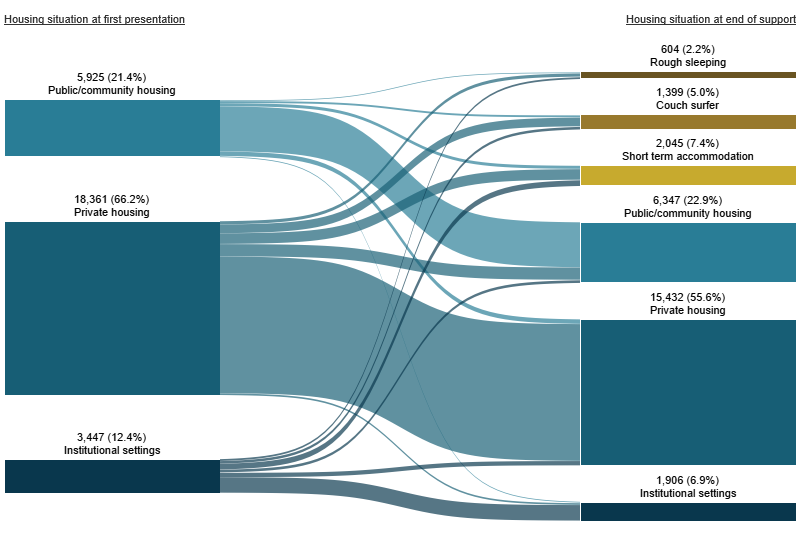
Notes:
- Excludes client with unknown housing situation.
- Includes only those clients who ceased receiving support during the financial year (meaning their support period(s) had closed and they were not in ongoing support at the end of the year).
Source: Specialist Homelessness Services Collection, 2018–19
For clients who were known to be homeless at the start of support (just over 24,200 clients) (Figure MH.3):
- 6,200 clients (25%) were in short term accommodation
- 5,400 (22%) were in private housing.
A further 5,200 clients (21%) were couch surfing at the end of support.
Figure MH.3: Housing situation for clients with closed support who were experiencing homelessness at the start of support, 2018–19
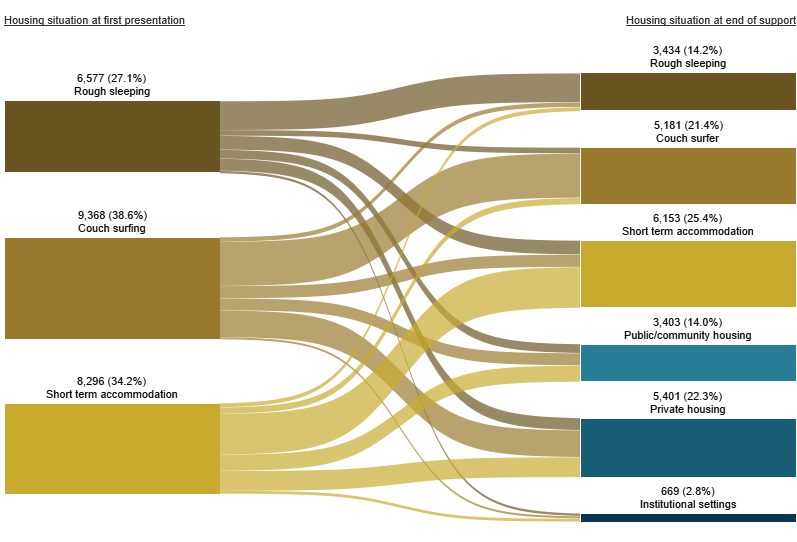
Notes:
- Excludes client with unknown housing situation.
- Includes only those clients who ceased receiving support during the financial year (meaning their support period(s) had closed and they were not in ongoing support at the end of the year).
Source: Specialist Homelessness Services Collection, 2018–19.