Clients in regional and remote areas
Access to services can become increasingly difficult the further away a client is from a major city. This section examines differences in client characteristics and service needs according to location. As per previous reports, for the purposes of the analysis, clients have been classified by geographical area based on the location of the agency from which they first received assistance in 2016–17. Agencies have been classified by geographical area based on the Australian Statistical Geography Standard [1] using the location details of each agency.
Key findings in 2016–17
- Client numbers increased across all regional areas in 2016–17, except Remote/very remote areas where they were similar to the previous year.
- Inner regional areas had the greatest increase in client numbers (over 5,000) with increases in both Indigenous and non Indigenous clients compared with 2015–16 (16% increase in Indigenous clients and 8% increase in non-Indigenous clients).
- The housing situation of clients when seeking assistance was very different across regional areas, with most clients (73%) in Remote/very remote areas housed, but living in unstable situations (at risk of homelessness), compared with clients in all other regional areas (54–58% at risk).
- The rate of service use continued to be highest in Remote/very remote areas, 1 in 37 people compared with 1 in 97 in Major cities and 1 in 67 in Inner and Outer regional areas in 2016–17.
- Remote/very remote areas had higher proportions of families presenting with children compared with Major cities while the proportion of lone persons was higher in Major cities.
Clients by geographic area: 2012–13 to 2016–17
Since 2012–13, there has been a steady increase in the number of clients across most geographic areas. The SHS collection continues to reveal differences in client characteristics and service needs across these areas. Some key regional trends over the past 5 years include:
- Taking into account population differences, Remote/very remote areas consistently reported the highest rate of homelessness service use and the gap with other regional areas is increasing (Table Regional Trends.1). Service use in Remote/very remote areas was 2.6 times higher than in Major cities in 2016–17, up from 2.3 times in 2012–13.
- Inner Regional areas showed the largest growth in the rate of service use, increasing on average by 4.6% each year since 2012–13.
- The proportion of Indigenous clients in Remote/very remote areas has increased from 81% in 2012–13 to 90% in 2016–17. Inner regional areas have also seen an increase in Indigenous clients with half (50%) of clients identifying as Indigenous in these areas in 2016–17, a rise of 5 percentage points over the 5 year period.
- Domestic and family violence has remained the main reason clients sought assistance in all regional areas except Inner regional areas when in 2016–17 housing crisis was reported by slightly more clients (25% housing crisis compared with 23% domestic and family violence).
Table Regional Trends.1: Clients by geographic area: at a glance—2014–15 to 2016–17
|
Year |
Major cities |
Inner regional |
Outer regional |
Remote/very remote |
|
|
Number of clients (proportion of all clients) |
|||||
|
2016–17 |
Number |
178,197 |
65,330 |
31,131 |
13,614 |
|
|
Per cent |
62 |
23 |
11 |
5 |
|
2015–16 |
Number |
174,744 |
60,013 |
30,790 |
13,650 |
|
|
Per cent |
63 |
21 |
11 |
5 |
|
2014–15 |
Number |
162,286 |
52,061 |
28,257 |
13,053 |
|
|
Per cent |
63 |
20 |
11 |
5 |
|
Rate (per 10,000 population) |
|||||
|
2016–17 |
|
103.4 |
148.9 |
149.0 |
271.5 |
|
2015–16 |
|
103.3 |
138.5 |
147.7 |
267.7 |
|
2014–15 |
|
97.6 |
121.6 |
136.0 |
252.0 |
|
Housing situation at the beginning of first support period (proportion all clients) |
|||||
|
2016–17 |
Homeless |
46 |
43 |
42 |
27 |
|
|
At risk of homelessness |
54 |
57 |
58 |
73 |
|
2015–16 |
Homeless |
45 |
43 |
43 |
27 |
|
|
At risk of homelessness |
55 |
57 |
57 |
73 |
|
2014–15 |
Homeless |
45 |
41 |
43 |
29 |
|
|
At risk of homelessness |
55 |
59 |
57 |
71 |
|
Length of support (median number of days) |
|||||
|
2016–17 |
|
34 |
46 |
37 |
20 |
|
2015–16 |
|
33 |
41 |
36 |
17 |
|
2014–15 |
|
32 |
39 |
36 |
17 |
|
Average number of support periods per client |
|||||
|
2016–17 |
|
1.8 |
1.6 |
1.5 |
1.6 |
|
2015–16 |
|
1.7 |
1.6 |
1.5 |
1.5 |
|
2014–15 |
|
1.7 |
1.5 |
1.5 |
1.5 |
|
Proportion receiving accommodation |
|||||
|
2016–17 |
|
28 |
25 |
37 |
59 |
|
2015–16 |
|
29 |
27 |
39 |
62 |
|
2014–15 |
|
31 |
29 |
41 |
58 |
|
Median number of nights accommodated |
|||||
|
2016–17 |
|
48 |
31 |
24 |
5 |
|
2015–16 |
|
48 |
34 |
23 |
5 |
|
2014–15 |
|
48 |
35 |
21 |
5 |
|
Proportion of a client group who had a case management plan (per cent) |
|||||
|
2016–17 |
|
59 |
64 |
74 |
64 |
|
2015–16 |
|
59 |
61 |
75 |
60 |
|
2014–15 |
|
58 |
61 |
73 |
62 |
|
Achievement of all case management goals (per cent) |
|||||
|
2016–17 |
|
25 |
16 |
27 |
23 |
|
2015–16 |
|
24 |
16 |
31 |
27 |
|
2014–15 |
|
27 |
18 |
30 |
29 |
Notes
- Rates are crude rates based on the Australian estimated resident population (ERP) at 30 June of the reference year. Minor adjustments in rates may occur between publications reflecting revision of the estimated resident population by the Australian Bureau of Statistics.
- The denominator for the proportion achieving all case management goals is the number of client groups with a case management plan. Denominator values for proportions are provided in the relevant National supplementary table.
- Previous years’ data can be found in the 2015–16 Specialist Homelessness Services Annual report.
Source: Specialist Homelessness Services Collection 2014–15 to 2016–17.
Characteristics of clients in regional and remote areas 2016–17
In 2016–17 regional areas displayed distinct characteristics:
- Most clients accessed services in Major Cities: A large proportion of clients accessing specialist homelessness services lived in Major cities (62%) (Supplementary Table REG.1). This is slightly lower than for the broader Australian population, 70% of whom live in Major cities (AIHW analysis of the ABS 2011 Census).
- The more remote areas have higher proportions of Indigenous clients: in 2016–17, 15% of clients living in Major cities were Indigenous, as were 24% in Inner regional areas, 50% in Outer regional areas and 90% in Remote/very remote areas. The greatest increase of Indigenous clients between 2015–16 and 2016–17 was in Inner regional areas (a 16 percentage point increase) (Supplementary table INDIGENOUS.5).
- Some client groups were more likely to access specialist homelessness services in Major cities: In 2016–17, 66% of SHS clients with a current mental health issue and 86% of SHS clients born overseas accessed specialist homelessness services in Major cities.
- The majority of Remote/very remote clients were Indigenous: A higher proportion of clients of homelessness services in 2016–17 were located in Remote/very remote areas (5%) compared with the general population (2%). Nine in 10 clients in Remote/very remote areas were Indigenous (90%).
- The proportion of clients living in Remote/very remote areas who were homeless upon presentation remained the same: 27% in 2015–16 and 2016–17 and is different to the homeless rate in other regional areas (Table Regional Trends.1).
- Accommodation length varied considerably across regional areas: In 2016–17, over half of the clients in Major cities received 48 or more nights’ accommodation while less than half of the clients in Remote/very remote areas received 5 or fewer nights (Table Regional Trends.1).
- Domestic and family violence was more commonly reported in Remote/very remote areas: The main reason clients sought assistance varied across regional areas; domestic and family violence and housing crisis were similarly reported as the main reason in Major cities (29%, 24%, respectively), Inner regional (23%, 25%), and Outer regional (26%, 24%) areas while domestic and family violence was reported by 1 in 3 (33%) clients in Remote/very remote areas and housing crisis just 14%.
The average number of support periods per client in Major cities was 1.8 compared with 1.6 for Inner regional and Remote/very remote areas, and 1.5 for Outer regional areas
46 days was the median number of days of support in Inner regional areas compared with 20 days of support for Remote/very remote areas
74% of clients in Outer regional areas had a case management plan compared with 59% in Major cities and 64% in Inner regional and Remote/very remote areas
59% of clients in Remote/very remote areas received accommodation compared with 25–37% for the other areas
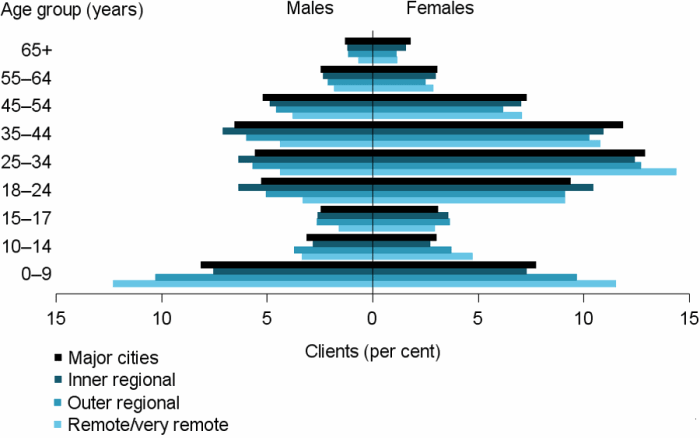
Age and sex
Figure REG.1 illustrates the distribution of clients by age and sex for 2016–17:
- About 1 in 4 clients in Remote/very remote areas (24%) were children under the age of 10; all other regional areas had lower rates, from 15% in Inner regional areas, 16% in Major cities and 20% in Outer regional areas.
- 1 in 5 clients in both Major cities and Inner regional areas were aged 25–34, making them the largest client groups (18% and 19%, respectively).
- Across all remoteness areas, there were more females than male clients (Figure REG.1). Females represented 60% of clients in Major cities, 59% of clients in Inner regional and Outer regional areas and 64% of clients in Remote/very remote areas.
The younger age of clients in more remote regions suggests that in Remote/very remote areas there were higher proportions of families presenting with children when compared with Major cities. It also reflects the younger age structure of Indigenous Australians who make up the majority of clients in these areas. Conversely, the proportion of lone persons was higher in Major cities.
Figure REG.1: Clients, by remoteness area and by age and sex, 2016–17
Source: Specialist homelessness services 2016–17, National supplementary table REG.1.
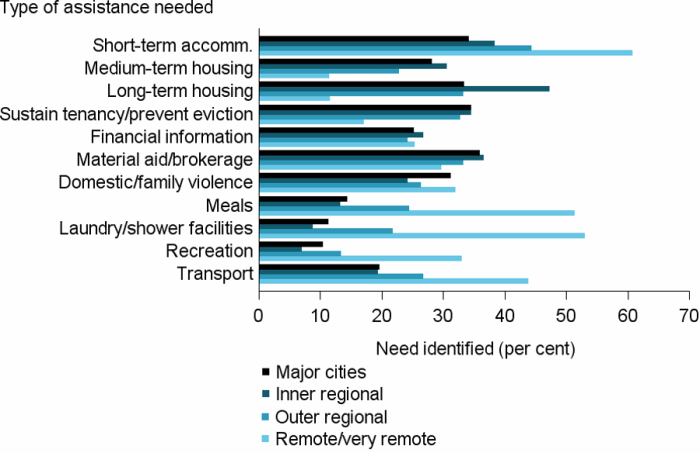
Services needed and provided
- Remote/very remote clients had the most needs: Clients accessing agencies located in Remote/very remote areas were assessed to have more needs compared with clients in all other areas (Figure REG.2).
- Almost half Inner regional clients needed long-term housing: Trends for clients accessing services in Inner regional areas were generally similar to those in Major cities. However, a higher proportion of clients accessing services in Inner regional areas needed long-term housing (47% compared with 33% in Major cities).
- Nearly 9 in 10 requests for accommodation were met in Remote/very remote areas (86%): The likelihood of receiving accommodation reduced with urbanisation. Clients in Major cities and Inner regional areas were the least likely to receive accommodation (54% and 41% of need met, respectively)
- Nearly 3 in 10 (28%) clients accessing services in Remote/very remote areas needed ‘other specialist services’: These services included health/medical (17%), specialist counselling (7%) and other specialised services (19%). Clients in Inner regional areas were the least likely to need these services (16%).
- The need for short-term accommodation increased with remoteness: There was an increase in the proportion of clients needing short-term or emergency accommodation as remoteness increased: Major cities 34%, Inner regional areas 38%, Outer regional areas 44%, and Remote/very remote areas 61%.
- The need for mental health services reduced with remoteness: Mental health services were needed by a higher proportion of clients living in Major cities (10%, or over 18,000 clients) and Inner regional areas (8%, or over 5,500 clients) than those in Outer regional areas (7%, or over 2,000) and Remote/very remote areas (4%, or over 500 clients).
Figure REG.2: Clients, by most needed services, by remoteness area, 2016–17
Notes
- Most needed excludes ‘Other basic assistance’, ‘Advice/information’, and ‘Advocacy/liaison on behalf of client’.
- Short-term accommodation includes temporary and emergency accommodation; medium-term housing includes transitional housing; and sustain tenancy/prevent eviction includes assistance to sustain tenancy or prevent tenancy failure or eviction.
- Proportions have been calculated using the client count for each remoteness area as the denominator.
Source: Specialist homelessness services 2016–17, National supplementary table REG.3.
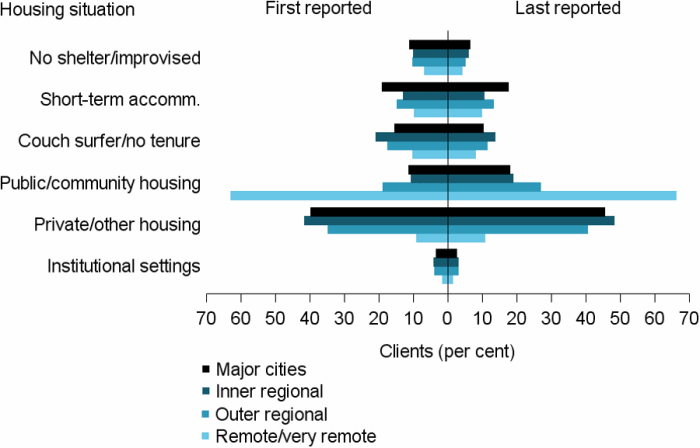
Housing outcomes
Stable housing, for the purpose of the SHSC, refers to clients ending support in public or community housing (renter or rent free), private or other housing (renter, rent free or owner), or Institutional settings.
- Over 6 in 10 clients in Major cities ended support in stable housing: Clients accessing services in Major cities were the least likely to report ending support in stable housing (66%), and most of these clients ended support in private or other housing as a renter, rent free or owner (45%) (Figure REG.3).
- Inner regional clients were the most likely to be housed in private or other housing following support (48%). They were also the most likely to improve their housing situation following SHS assistance with 70% housed at the end of support, up 14 percentage points from the beginning of support.
- Remote/very remote clients were the most likely to need support while in social housing: Those clients accessing agencies in Remote/very remote areas were more likely to report living in public or community housing (63%) at the beginning of their support. While these clients were the most likely to be classified as ‘housed’ at the end of their support period (78%) this is to some extent a reflection of their housing situation prior to SHS assistance.
Figure REG.3: Clients, by housing situation at beginning of support and end of support, by remoteness area, 2016–17
Notes
- The SHSC classifies clients living with no shelter or improvised/inadequate dwelling, short-term temporary accommodation, or in a house, townhouse, or flat with relatives (rent free) as homeless. Clients living in public or community housing (renter or rent free), private or other housing (renter or rent free), or in institutional settings are classified as housed.
- No shelter/improvised includes inadequate dwellings; short-term accommodation includes temporary and emergency accommodation; couch surfer/no tenure includes living in a house, townhouse or flat with relatives rent free; public/community housing includes both renting or rent free; and private/other housing includes both renting or rent free.
- Proportions include only clients with closed support at the end of the reporting period.
Source: Specialist homelessness services 2016–17, National supplementary table REG.4.
There are differences in stable housing achievements for clients who present either homeless or housed, but at risk of homeless (Table REG.2).
Across all regions, agencies were best able to assist those presenting at risk of homelessness, with 9 in 10 maintaining their housing following support.
- Of these clients, 84% of clients in Major cities, and Inner and Outer regional areas were assisted to remained housed in public or community housing (around 9,800 and 3,800 clients, respectively) with a further 8% housed in private/other housing.
- 91% of clients in Remote/very remote areas were assisted to remain housed in public or community housing (about 5,200 clients) with a further 2% housed in private/other housing.
For those clients presenting homeless, agencies were able to assist around 4 in 10 clients into stable housing at the end of support.
-
For clients presenting homeless, living in short-term or emergency accommodation, agencies across all regional areas were able to assist almost half of these clients into stable housing (42–49%).
Table REG.2: Clients by geographic area, housing situation at beginning and end of support, 2016–17 (per cent)
| Situation at beginning of support | Situation at end of support: homeless |
Situation at end of support: housed |
|---|---|---|
| Major cities | ||
| Homeless | 63.5 | 36.5 |
| At risk of homelessness | 10.0 | 90.0 |
| Inner regional | ||
| Homeless | 57.4 | 42.6 |
| At risk of homelessness | 9.4 | 90.6 |
| Outer regional | ||
| Homeless | 59.1 | 40.9 |
| At risk of homelessness | 8.5 | 91.5 |
| Remote/very remote | ||
| Homeless | 60.2 | 39.8 |
| At risk of homelessness | 7.6 | 92.4 |
Notes
- The SHSC classifies clients living with no shelter or improvised/inadequate dwelling, short-term temporary accommodation, or in a house, townhouse, or flat with relatives (rent free) as homeless. Clients living in public or community housing (renter or rent free), private or other housing (renter or rent free), or in institutional settings are classified as housed.
- Proportions include only clients with closed support at the end of the reporting period. Per cent calculations are based on total clients, excluding ‘Not stated/other’.
Source: Specialist homelessness services 2016–17, National supplementary table REG.4.
Reference
- Australian Bureau of Statistics (ABS), 2013. Australian Statistical Geography Standard (ASGS): Volume 5—Remoteness structure, July 2011. ABS cat. no. 1270.0.55.005. Canberra: ABS.