Did the patient spend any time in intensive care?
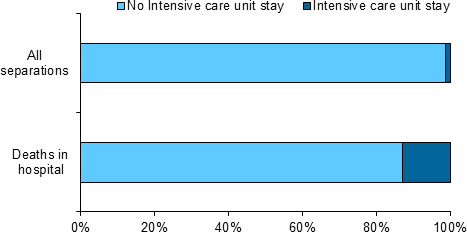
In 2014–15, separations that ended in death were more likely to involve a stay in an intensive care unit (ICU) (12.8% or 9,829) compared with all hospital separations (1.3%, 131,236) (Figure 11).
Intensive care unit data reported here is from public hospitals that had an approved level 3 ICU or an approved paediatric ICU. Data for private hospital ICUs was only available for Victoria, Queensland, Western Australia and South Australia and the ICU level was not specified. Therefore, these numbers are likely to underestimate stays in intensive care. Data are not available on whether the death occurred in the ICU or elsewhere in the hospital.
Figure 11: Proportion of hospital separations that included a stay in an intensive care unit, 2014–15
Source: NHMD.
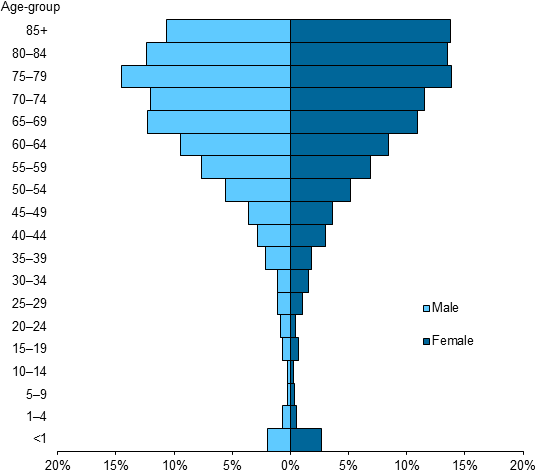
In 2014–15, patients aged 65 years and over accounted for almost two-thirds (63%, 6,148) of deaths in hospital that involved a stay in an ICU, and these accounted for about 10% of deaths in hospital for patients aged 65 years and over (Figure 12). About 2% (221) of deaths in hospital that involved a stay in an ICU were for infants under 1—these accounted for about 24% of deaths in hospital for infants under 1.
Figure 12: Proportion of deaths in hospital that involved an ICU stay by age-group and sex, 2014–15
Source: NHMD.
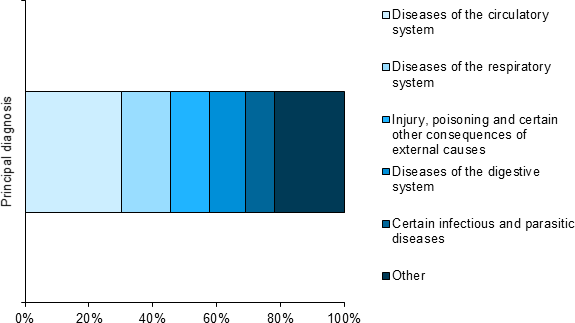
About 30% of separations that ended in death which involved a stay in an ICU (2,977) reported a principal diagnosis within Diseases of the circulatory system (Figure 13).
Figure 13: Proportion of deaths in hospital that involved an ICU stay by ICD-10-AM principal diagnosis chapter, 2014–15
Source: NHMD.
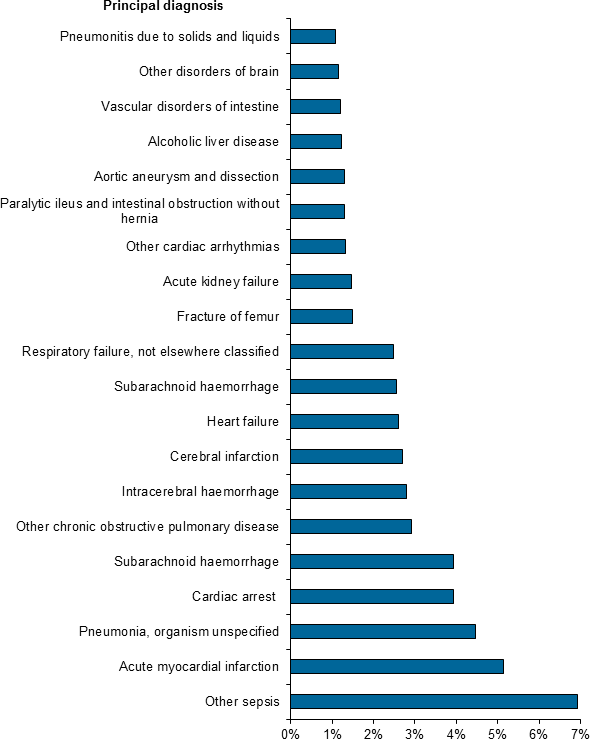
Figure 14 shows the 20 most common 3-character principal diagnoses for deaths in hospital that involved a stay in an ICU in 2014–15. These twenty principal diagnoses accounted for 52% (5,104) of these episodes. The top five (Other sepsis, Acute myocardial infarction, Pneumonia organism unspecified, Cardiac arrest and Subarachnoid haemorrhage) accounted for 24% (2,395) of principal diagnoses for deaths in hospital that included a stay in an ICU. It is not known whether the principal diagnosis was related to the ICU stay or not.
Figure 14: The 20 most common 3-character principal diagnoses reported for deaths in hospital that involved a stay in ICU, 2014–15, per cent
Source: NHMD.