Who used these hospital services?
The majority of separations for patients aged 85 and over (55% or 380,202) were for females (who account for 63% of the population in this age group) (Figure 2).
Figure 2: Proportion of separations for patients aged 85 and over by sex, 2014–15
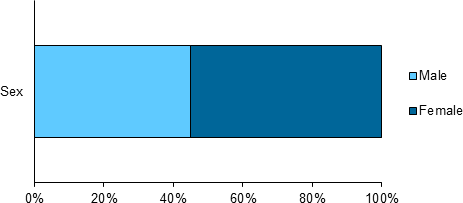
Source: NHMD.
Patients aged 85–89 (who make up 64% of the population aged 85 and over) accounted for two-thirds of these separations (67%, 461,426). For patients aged over 100 there were 2.7 times as many female separations (2,686) compared to male separations (999) (Figure 3).
Figure 3: Proportion of separations for patients aged 85 and over by age group and sex, 2014–15
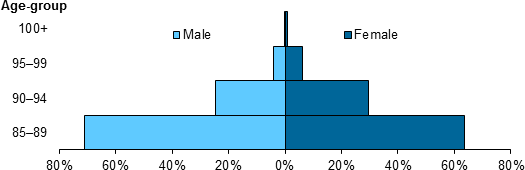
Source: NHMD.