How has this activity changed over time?
The total number of separations for patients aged 85 and over almost doubled from 359,472 in 2005–06 to 690,658 in 2014–15.
Separations for patients aged 85 and over increased as a proportion of all separations, from 4.9% in 2005–06 to 6.8% in 2014–15 (Figure 7).
Figure 7: Separations for patients aged 85 and over as a proportion of all separations, 2005–06 to 2014–15
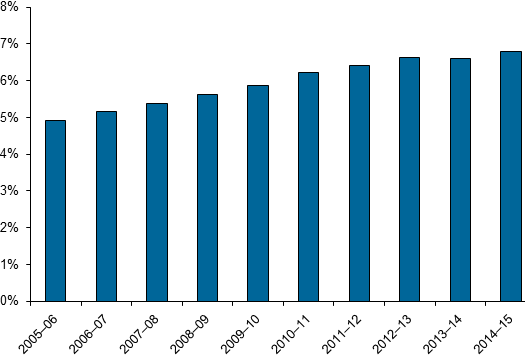
Source: NHMD.
As the numbers of separations for patients aged 85 and over increased, the mix of same‑day and overnight separations changed.
In 2005–06, same-day separations represented 31% (110,910) of all separations for patients aged 85 and over, increasing to 42% (287,933 separations) in 2014–15. The proportion of separations that were overnight fell, even though they increased in volume over the period (Figure 8).
Figure 8: Same-day and overnight separations for patients aged 85 and over, 2005–06 to 2014–15
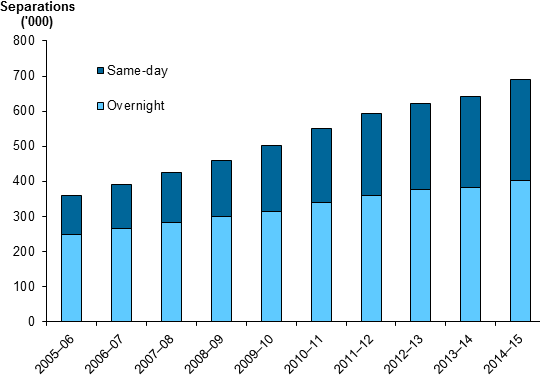
Source: NHMD.
In 2014–15, the number of separations for people aged 85–89 outnumbered all separations for people aged 85 and over for each year in the period 2005–06 to 2008–09 (Figure 9).
Figure 9: Separations for patients aged 85 and over by age-group, 2005–06 to 2014–15
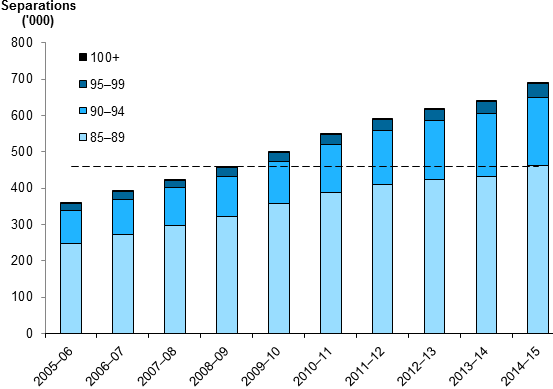
Source: NHMD.