Health and welfare services key points
Population health programs
Among Indigenous mothers who gave birth in 2011, half (50%) had attended at least 1 antenatal visit in the first trimester; Indigenous mothers were less likely than non-Indigenous mothers to have done so (age-standardised rates of 51% and 66%, respectively).
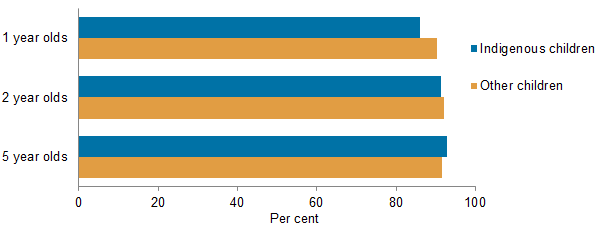
In 2013, the proportion of Indigenous and non-Indigenous children who were fully vaccinated at ages 2 and 5 were similar, while 86% of Indigenous children aged 1 were fully vaccinated compared with 90% of other children of the same age.
Proportion of children fully vaccinated at 1, 2 and 5 years of age, by Indigenous status, 31 December 2013
In 2012–13, 57% of Indigenous women aged 18 and over reported they had a Pap test at least every 2 years. In the 2-year period 2011–2012, 38% of Indigenous women aged 50–69 participated in a BreastScreen program, compared with 54% of non-Indigenous women.
Primary health care and dental care
In 2013–14, over 3.6 million GP services were claimed through Medicare for Indigenous people. Such services were claimed at 1.1 times the rate for non-Indigenous Australians, with Indigenous Australians more likely to have long or complex GP consultations.
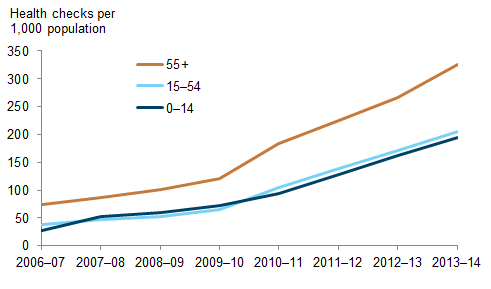
The rate of use of Indigenous health checks for children, adults and older people increased significantly over time—for example, between 2006–07 and 2013–14, rates of Indigenous adult health checks (for those aged 15 to 54) rose by an average annual rate of 25% (from 39 to 205 checks per 1,000 population).
Rates of Medicare Benefit Schedule health checks for Indigenous Australians (MBS item 715), by target age group, 2006–07 to 2013–14
In 2012–13, about 3.1 million episodes of care were provided by 205 Indigenous-specific primary health care organisations funded by the Australian Government.
In 2012–13, 14% of Indigenous Australians aged 2 and over had never consulted a dental professional compared with 5% of all Australians.
Hospital services
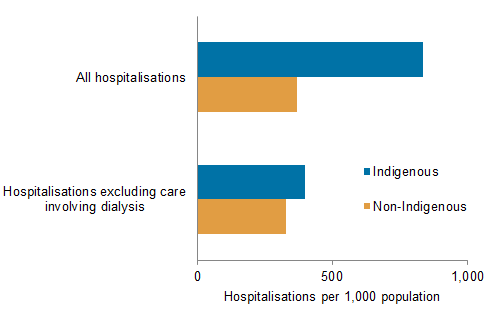
In 2012–13, there were about 384,638 hospitalisations for Indigenous people, accounting for 4.1% of all hospitalisations. The hospitalisation rate for Indigenous Australians was 2.3 times the rate for non-Indigenous Australians (based on age-standardised rates). Much (84%) of the difference in the rates was due to the substantially higher rates of hospitalisations for dialysis among Indigenous people. Excluding hospitalisations for dialysis, the rate for Indigenous people was 1.2 times the rate for non-Indigenous people.
Age-standardised hospitalisation rates, by Indigenous status, 2012–13
In 2013–14, there were 392,142 public hospital emergency department presentations by Indigenous people, accounting for 5.4% of all such presentations.
Mental health and drug treatment services
In 2012–13:
- the rate of community mental health service contacts for Indigenous people was 3.2 times the rate for non-Indigenous people (age-standardised rates of 999 and 313 per 1,000 population, respectively)
- an estimated 15,356 clients of publicly-funded alcohol and/or other drug treatment services were Indigenous, accounting for 14% of clients
- Indigenous-specific organisations provided about 305,000 episodes of care for substance-use.
Welfare services
In 2012–13, 36,656 Indigenous children received child protection services. Indigenous children were 7 times as likely as non-Indigenous children to have received such services (127 and 18 per 1,000 children, respectively).
In 2012–13, 17,406 Indigenous Australians used disability support services, representing 5.8% of all users.
At 30 June 2013, there were 1,299 Indigenous permanent residents in Australian Government-subsidised residential aged care facilities (0.8% of all residents). Of these residents, 27% were aged under 65 (compared with 3.4% of non-Indigenous residents) and half (51%) had dementia (similar to the 52% of non-Indigenous residents).
About 67,700 Indigenous households lived in social housing at 30 June 2013. Indigenous households (31%) were more than 6 times as likely as other households (4.5%) to live in social housing. In June 2013, between 43% and 46% of Indigenous households were receiving support from at least 1 of the major housing assistance programs (that is, social housing and Commonwealth Rent Assistance); this compares with 18% of other households.
In 2012–13, one–fifth (22%) of clients of specialist homelessness services were Indigenous—an estimated 54,885 people.
Differences by remoteness
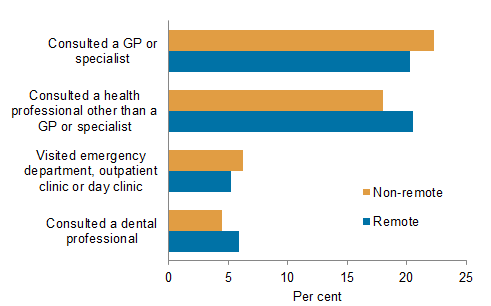
In 2012–13, similar proportions of Indigenous people in non-remote and remote areas had consulted a GP or specialist (22% and 20%, respectively) or a health professional other than a GP or specialist (18% and 21%) in the 2 weeks prior to being surveyed.
Actions taken for health in previous 2 weeks by Indigenous people, by remoteness, 2012–13
In 2012–13:
- rates of pneumococcal vaccination among Indigenous people aged 15 and over increased with remoteness (from 8% in Major cities to 24% in Very remote areas)
- there was no significant difference by remoteness in either the proportion of Indigenous women aged 18 and over reporting having a Pap test at least every 2 years, or the proportion of Indigenous women aged 40 and over reporting having regular mammograms
- 45% of Indigenous-specific primary health care organisations were located in remote areas, as were 43% of Indigenous-specific organisations providing substance-use services
- Indigenous Australians aged 2 and over living in remote areas were more likely than those in non-remote areas to have never consulted a dental professional (21% and 12%).
During the 2-year period 2010–12, Indigenous Australians living in Remote and very remote areas had higher hospitalisation rates than those in other areas.
The proportion of Community Aged Care Package (CACP) recipients at 30 June 2013 who were Indigenous increased with remoteness, from 1.4% of all CACP recipients in Major cities to 55% in Remote and very remote areas. At 30 June 2013, 84% of residential aged care services provided under the National Aboriginal and Torres Strait Islander Flexible Aged Care Program and the Multi-Purpose Service Program were located in Outer regional (41%), Remote (19%) or Very remote (25%) areas.