How have suicide deaths changed over time?
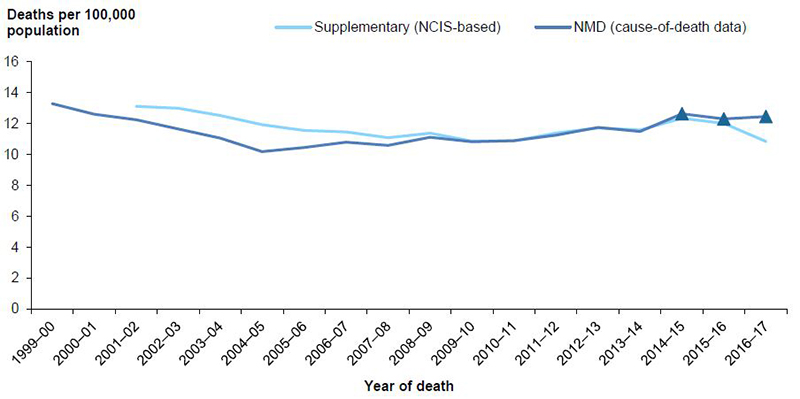
Crude rates of suicide, based on data from the NMD, fell from 13.3 deaths per 100,000 population in 1999–00 to 10.2 deaths per 100,000 in 2004–05, before rising to 12.6 deaths per 100,000 by 2014–15, then remaining relatively steady (Figure 10.1).
Supplementary estimates, based on NCIS data as at March 2019, indicate a more constant downward trend in age-standardised rates of suicide for 2001–02 to 2009–10, with rates rising again towards the end of the charted period.
Further information on the method used to produce the supplementary estimates is provided in Appendix A.
Between 2008–09 and 2015–16, both data sources produced very similar annual rates of suicide. Rates for 2014–15 to 2016–17 might rise, as revisions to causes for deaths are reported to coroners.
The difference between the 2 series for earlier years, before the ABS revised its methods, is consistent with earlier work (AIHW: Henley & Harrison 2009; AIHW: Harrison et al. 2009). A previous report of suicide deaths in 2004–05, based on NCIS data in 2008, estimated there were 2,341 deaths for that year (AIHW: Henley & Harrison 2009), which is similar to numbers used to calculate the supplementary rate for 2004–05, shown in Figure 10.1 (2,395).
Further information on the effects of changes in methods on estimates of suicide for 1999–2010 has previously been reported (AIHW: Harrison & Henley 2015).
Figure 10.1: Crude rates of suicide deaths for cause-of-death (NMD) data and supplementary (NCIS-based) data, 1999–00 to 2016–17
Notes:
- Values for the latest 3 years of NMD-based rates, shown as triangles, are subject to change due to later revisions of cause-of-death data by the ABS (see Appendix A for more information).
- Data underpinning this figure are available in the supplementary table spreadsheet Table SF10.1.
Sources: AIHW NMD; NCIS.
Firearm-related suicides
Between 1999–00 and 2016–17, there were 3,347 firearm-related suicides, of which 168 (5%) were females (Table S.1). After the ABS revised its process (from 2006–07), the annual numbers of firearm-related suicides were higher than the number of suicides that would have been recorded using the pre-revisions processes.
Reasons for this are detailed in Appendix A, and have previously been reported for 1999–2010 (AIHW: Harrison & Henley 2015). Long-term trends for firearm-related suicides have previously been reported (AIHW: Harrison & Henley 2014).
Age and sex
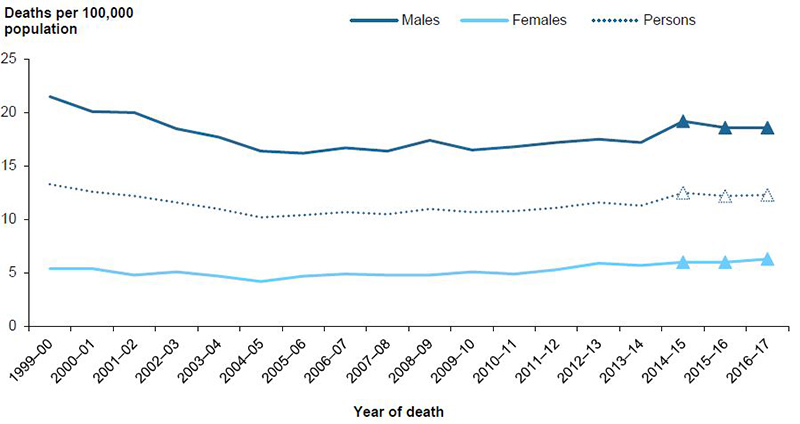
Age-standardised rates of suicides fell from 13.3 deaths per 100,000 population in 1999–00 to 10.2 per 100,000 in 2004–05, before rising to 12.5 per 100,000 by 2014–15 (Figure 10.2).
The pattern was similar for both males and females. For males, rates fell from 21.5 deaths per 100,00 population in 1999–00 to 16.2 per 100,000 in 2005–06, before rising to 19.2 per 100,000 by 2016–17. For females, rates fell from 5.4 per 100,000 1999–00 to 4.2 per 100,000 in 2004–05, before rising to 6.3 per 100,000 by 2016–17. The rise in female rates from 2004–05 onwards was close to 3% per year and was statistically significant. Rates were consistently 3–4 times as high for males as for females.
Figure 10.2: Age-standardised rates of suicide deaths, by sex, 1999–00 to 2016–17
Notes:
- Values for the latest 3 years, shown as triangles, are subject to change due to later revisions of cause-of-death data by the ABS (see Appendix A for more information).
- Data underpinning this figure are available in the supplementary table spreadsheet Table SF10.2.
Source: AIHW NMD.
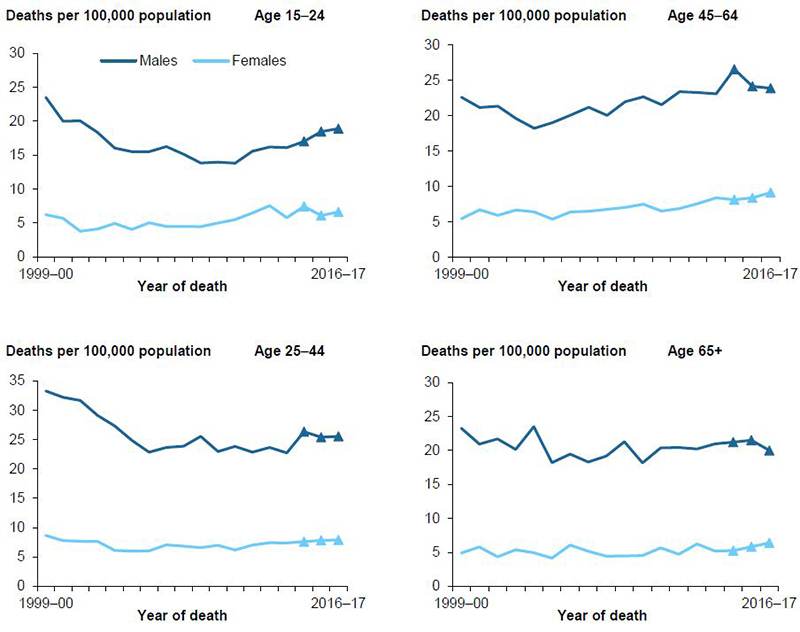
Figure 10.3 shows changes in suicide rates between 1999–00 and 2016–17 in each age group by sex.
Age-standardised rates for males were much higher than rates for females across all age groups for all years.
Rates for males aged 15–24 and 25–44 declined markedly in the first half of the period of interest. But for those aged 15–24, rates rose again in the latter part of the period, while for those aged 25–44, they remained relatively steady after the initial fall. There was an overall rise in rates over the period for males aged 45–64, while rates for males aged 65 and over remained relatively steady.
Rates for females aged 15–24 and 45–64 rose over the period, while rates for females aged 25–44 and 65 and over remained relatively steady.
Figure 10.3: Age-specific rates of suicide deaths, by age and sex, 1999–00 to 2016–17
Notes:
- Values for the latest 3 years, shown as triangles, are subject to change due to later revisions of cause-of-death data by the ABS (see Appendix A for more information).
- Data underpinning this figure are available in the supplementary table spreadsheet Table SF10.3.
- Rates for children aged 0–4 and 5–14 are not shown, due to small numbers.
Source: AIHW NMD.
Remoteness of usual residence
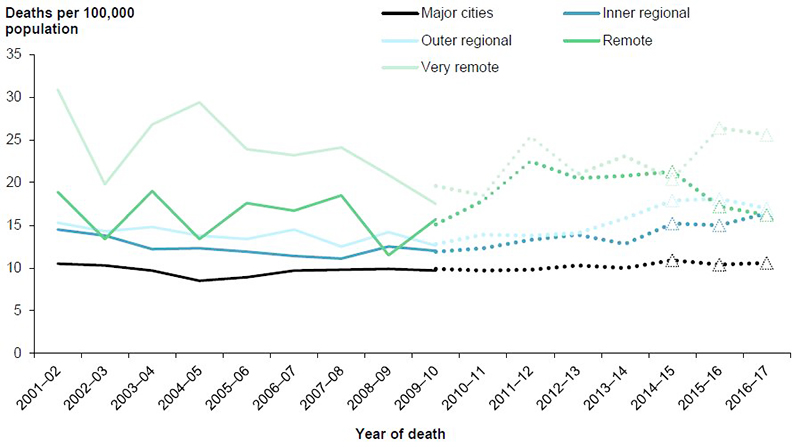
Between 2001–02 and 2016–17, rates of suicide deaths were consistently higher for residents of Very remote areas than for residents of all other remoteness areas (Figure 10.4). Rates for residents of Very remote areas were consistently 2–3 times as high as rates for residents of Major cities.
The fluctuation in the rates of suicide deaths in the Very remote and Remote areas of Australia is partly a reflection of the small population and number of deaths occurring each year. Rates for residents of Inner regional and Outer regional areas rose in the latter part of the period, while rates for residents of Major cities remained relatively steady.
In 2009–10, the only year for which both ASGC-based and ASGS-based rates are shown, the ASGS-based rate was higher than the ASGC-based rate for Very remote areas.
See Appendix A for more information of the ASGC and ASGS classification systems.
Figure 10.4: Age-standardised rates of suicide deaths, by remoteness of usual residence, 2001–02 to 2016–17
Notes:
- Data for 1999-00 and 2000–01 were unavailable.
- Full lines are ASGC-based, while dotted lines are ASGS-based.
- Values for the latest 3 years, shown as triangles, are subject to change due to later revisions of cause-of-death data by the ABS (see Appendix A for more information).
- Data underpinning this figure are available in the supplementary table spreadsheet Table SF10.4.
Source: AIHW NMD.
Aboriginal and Torres Strait Islander people
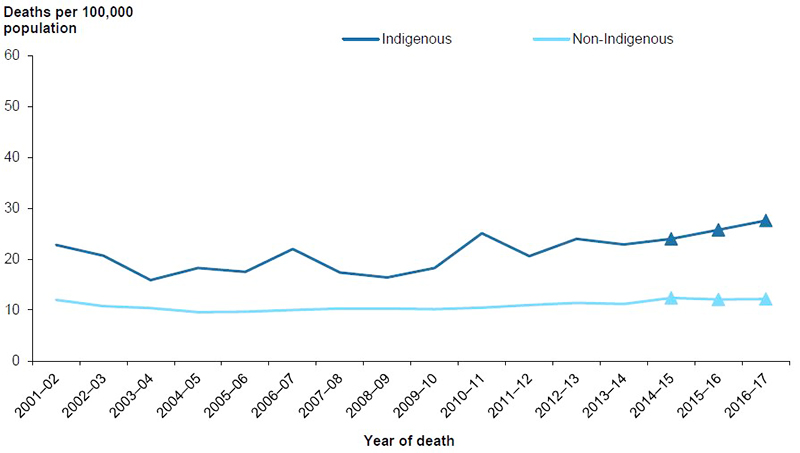
Age-standardised rates of suicide deaths for Aboriginal and Torres Strait Islander people fluctuated to some degree between 2001–02 and 2016–17, recording a statistically significant rise of 2.8% per year (Figure 10.5).
Rates for non-Indigenous Australians did not change significantly over the period. Rates for Aboriginal and Torres Strait Islander people were consistently 1.5–2.5 times as high as the rates for non-Indigenous Australians over this period.
Figure 10.5: Age-standardised rates of suicide deaths, by Indigenous status, 2001–02 to 2016–17
Notes:
- Data are for New South Wales, Queensland, Western Australia, South Australia, and the Northern Territory, the 5 jurisdictions for which recording of Indigenous status was considered to be of adequate quality throughout the study period.
- Values for the latest 3 years, shown as triangles, are subject to change due to later revisions of cause-of-death data by the ABS (see Appendix A for more information).
- Data underpinning this figure are available in the supplementary table spreadsheet Table SF10.5.
Source: AIHW NMD.