Patterns in MBS services between 2001 and 2023 by remoteness
Major cities and inner regional areas have had the highest monthly MBS services rate per person and this rate has been increasing over time (Figure 5).
Major cities (MBS services rate of 18.3) and Inner regional areas (MBS services rate of 18.0) had the highest MBS services rates during 2022 and Remote areas (MBS services rate of 10.9) and Very remote areas (MBS services rate of 8.5) had the least (Table 1). Very remote (84.9%) and Remote areas (78.6%) had the highest MBS subsidy rates during 2022.
Monthly MBS subsidy rates by remoteness have remained relatively stable over time, with Very remote areas receiving the highest monthly MBS subsidy rates (Figure 6).
Figure 5: Monthly MBS services rates by remoteness
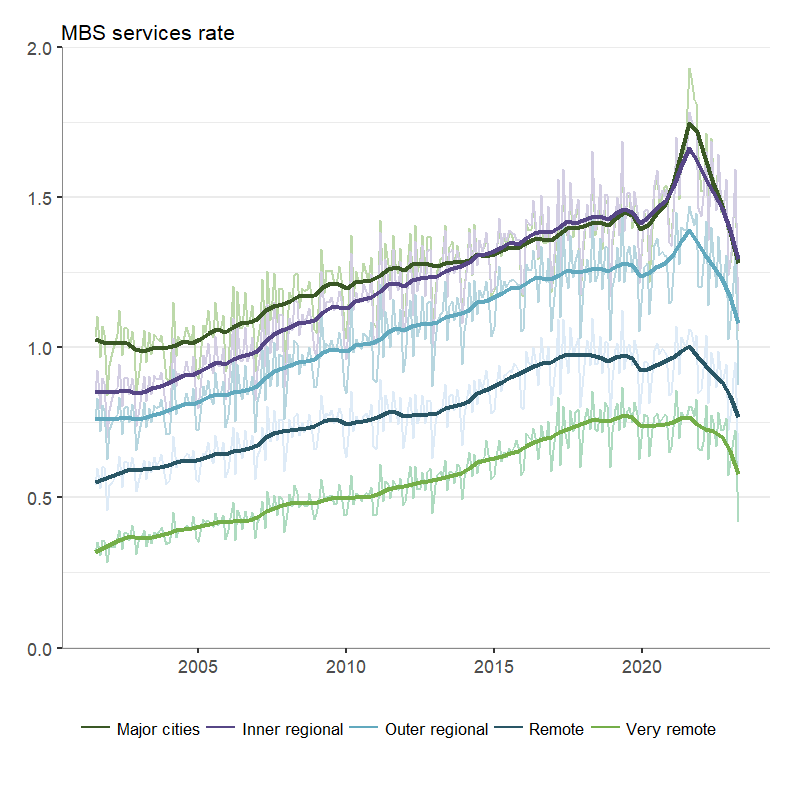
Chart: AIHW. Source: MBS funded services dashboard.
Figure 6: Monthly MBS subsidy rates by remoteness
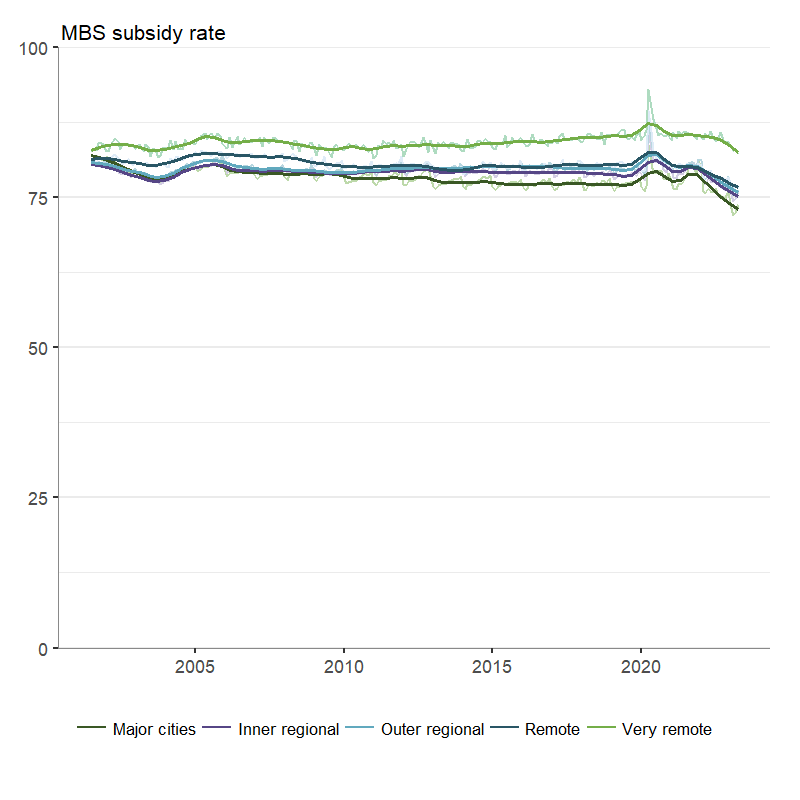
Chart: AIHW. Source: MBS funded services dashboard.