Patterns in MBS services between 2001 and 2023 by socioeconomic area
The general trend across all socioeconomic areas has been toward higher MBS service rates (based on IRSD SEIFA) between 2001 and 2023 (Figure 7), with lower socioeconomic areas receiving higher monthly MBS subsidy rates compared with higher socioeconomic areas (Figure 8).
The lowest socioeconomic areas had the lowest MBS services rates (SEIFA 1 had an MBS services rate of 16.9, Table 1) but the highest MBS subsidy rates (SEIFA 1 had a rate of 83.8% compared to SEIFA 5 with a rate of 72.0%) during 2022.
Figure 7: Monthly MBS services rates by SEIFA
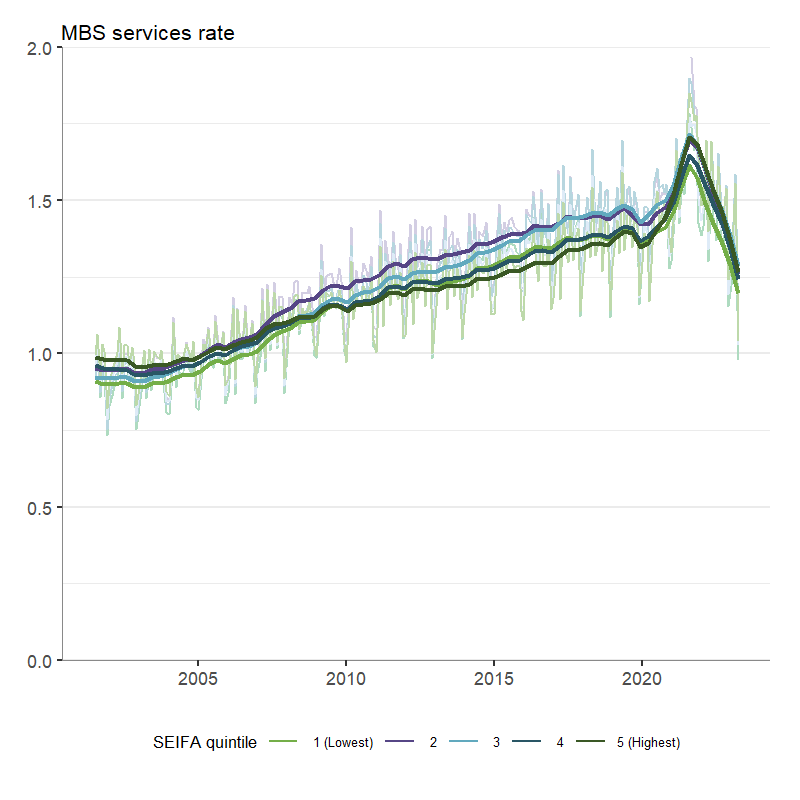
Chart: AIHW. Source: MBS funded services dashboard.
Figure 8: Monthly MBS subsidy rates by SEIFA
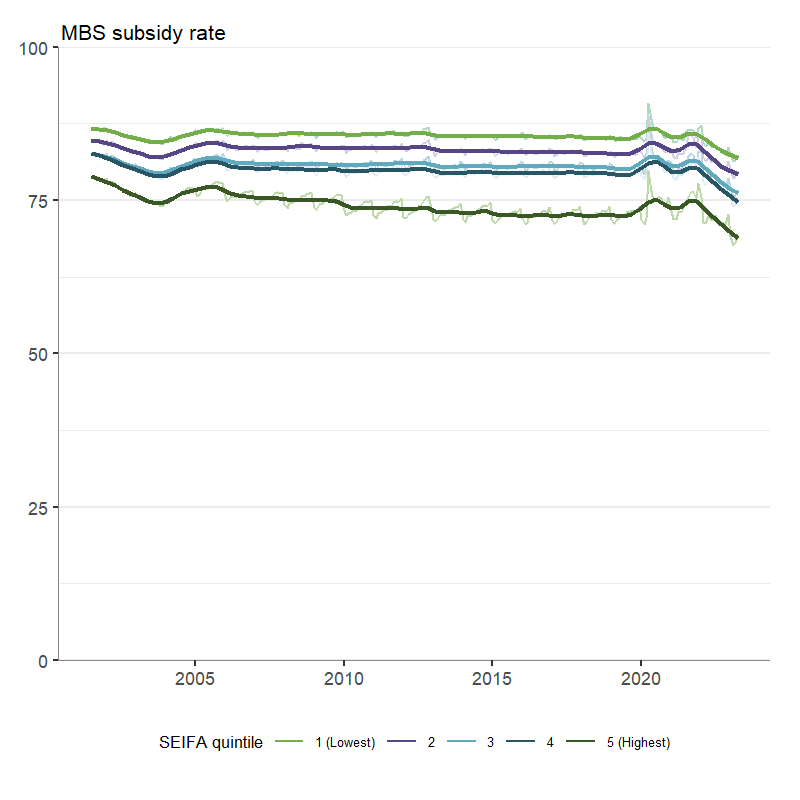
Chart: AIHW. Source: MBS funded services dashboard.